Please enable javascript in your browser to view this site!

Market Update & Blog

Actionable Intelligence through Analytical Interpretation

Posts tagged vancouverhousing
Anemic Detached Inventory Pushed Home Values Higher in 2020, Will This Continue in 2021?

The Greater Vancouver real estate detached market was seriously deprived of inventory during 2020. Resulting in the lowest amount of homes for sale in the past 15 years. The total amount of available detached properties achieved just 50,225. Which is down nearly 30% from the 15 year average of 70,082. 2020 was by far and away the lowest total active listings. Recent history shows during 2016 there was 58,650 active listings, 2017: 65,974, 2018: 75,459, 2019: 69,630. Comparing 2020 to 2018, there was a drop of 33% available properties.

Some analysts believe the increased prices were due to the increased demand, we disagree. The 2020 total sales completed with over 10,800. This data point indicates an increase compared to the previous 2 years of data but well below the 15 year average of 12,748 sales.

Eitel Insights believes the increased prices resulted directly from anemic levels of inventory, along with lower interest rates, which resulted with increasing home values. The statistical anomaly of not being able to surpass 5000 active listings in any month during 2020 will not likely occur again in 2021. The increase to the number of mortgage in arrears will likely result with increased inventory, due to need based sellers. Add in the struggling economy with continually increasing personal debt, just as government stimulus wanes.

All in all, there is a possibility the market can sustain current pricing levels, if the inventory does continue to buck historical norms. The more likely outcome is inventory increases along with a diminished demand for the detached homes, due to the pulled forward sales which occurred during 2020.

This low level of inventory combined with sudden demand to own a detached properties combined for the perfect storm and forced prices the highest price of 2020 during December. Achieving a 1.770M average sales price across Greater Vancouver, the highest sales price since May 2018. During the upcoming year, if inventory remains virtually non-existent, prices can be sustained into 2021.

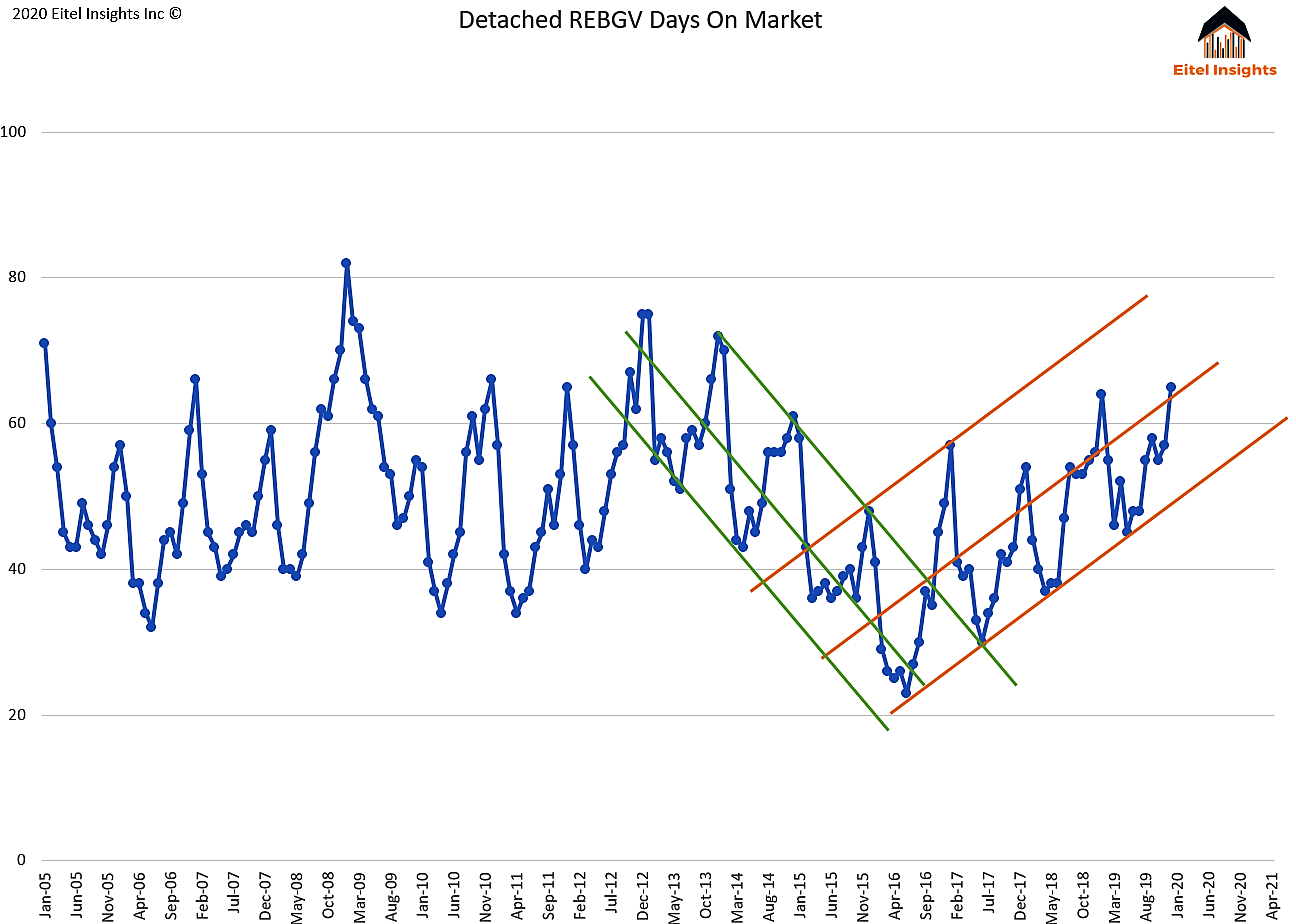
As the majority of detached homes are owner occupied, the thought of having buyers come through your home during the pandemic was not acceptable to most. Even though prices increased over $190,000 from the May 2020 low of $1.586M to over $1.770M in December. The inventory hit its 15 year low of just 2,762 active listings in December 2020. Typically inventory increases as the prices rise. With prices back into the upper third of the current market cycle, and a vaccine en route, the notion of selling will become acceptable again.

Those who are willing to list will reap the rewards, the December low data point not only broke below 3000 active listings for the 2nd time in 16 years but the data broke the longer term uptrend which was established during 2015. Is the historic low of December due to the recent shutdown measures imposed by the government or will the low levels persist?

The data accumulated in the initial 6 months of the 2021 market will likely set the tone for years to come. If the inventory remains at extreme lows, prices can be sustained at the current level with a possibility of achieving a new all-time high. If this occurs, the growth cycle will have been born through the lack of supply. We anticipate this to be the less likely scenario of the two. Longer term, yes, prices will eventually escape the market cycle that Vancouver has been in since 2016, but in the short term we believe the impact of a deteriorating economy will force the home prices back lower in the market cycle to test previously established price points.

Interesting point, when there is an anomalous low data point, the market historically reacts with a much higher set of data, in an effort to counter act the anomaly. This implies inventory could rebound heavily in 2021.

Prices were volatile during 2020. Home values began the year with an average sales price of 1.590M in January. During February there was a spike higher with the average sales price achieving 1.710M. After the first lock down, prices fell back to 1.586M in May. Then like a shot out of a cannon, home values rapidly increased back up to the February high and beyond. With the December price reaching 1.770M that indicates prices have re-entered the upper third of the market cycle, only down 3% form the all-time high of 1.830M experienced during April of 2017.

Home values rose due to the serious lack of options, the peak of inventory during 2020 could not rise above 5,000 active listings. In the past 16 years, 2020 was the first instance where not one single month of active listings was able to achieve above 5,000 detached properties for sale. The limited inventory forced buyers to compete with each other for the very few new listings that came out each month. Until inventory begins to dramatically improve, prices will have an artificial bottom which could propel the market higher.

The detached market finished 2020 with over 10,800 sales. A relatively high number considering there was only 393 sales during April 2020. This unusual activity given historical seasonal norms, meant the spring market was pushed into the summer, summer to fall and so on.

Taking the year as a whole, rather than using year over year monthly indicators which were heavily affected by the initial lock down, the data become much less impressive. Sales rose to 10,832 during 2020 which is down 15% from the 15 year average of 12,748. The 2020 sales were higher than the 2019 & 2018 totals, but below the 2005, 2006, 2007, 2009, 2010, 2011, 2013, 2014, 2015, 2016, and 2017.

Greater Vancouver detached achieved the 5th lowest sales total in the past 16 years. Again to the earlier point, the increase of home values during 2020 had less to do with the sales, and everything to do with the inventory.

Going forward the key to the detached market can be reduced to one factor, supply. With home prices back up to the 2016 levels coupled with an economy is not recovering nearly as fast as the housing market would indicate. The Covid vaccine is seemingly on the way, coupled with higher prices than 2019 and 2020, owners who put selling their property on the back burner, may refocus during 2021. Again the current inventory is only at 2,762 signalling the lowest level on the 15 year chart. This creates an excellent selling opportunity for home owners.

Detached Inventory.png
Detached Price.png
Detached Sales.png
Divergent Trends Dominate the Vancouver Housing Market

The value of technical analysis has become a massive benefit to investors who take advantage of the actionable intelligence produced through analytical interpretation. Let’s recall where the market has been before we get into where it is going. During the uncertain and frenzied market conditions technical analysis allowed Eitel Insights to call the top, first to do so of our analytical peers. More importantly than being first the call was correct. After breaking the growth trend in 2017 (green line) prices dropped off from 1.830 average sales price in May 2017, to 1.468Million during Feb 2019. The recent rebound was technically predicable as well.

The rationale as to why prices found a temporary bottom during 2019 is the properly place technical trend lines established during the 2008 -2009 recovery (black uptrends). As prices were down 19% from peaks, Eitel Insights did say buyers are coming off the benches due to the mitigation of the stress tests, along with home values decreasing back to 2015 levels

Prices had a prolonged test of the uptrend (lower black line) during 2019, with over 5 months of pricing data testing the staunch trend. Prices can only test a trend for so long before moving on to create a new trend, or test another previously established trendline. Current prices of 1.714Million are back up testing the downtrend which was created during the market peak and subsequent lower price points. While some analysts and the real estate boards have touted the recent increase in prices as the forever win, we see it as a typical lower highs coupled with lower lows in order to fulfill the identified market cycle.

Currently, prices are obviously testing the downtrend, coupled with the lower echelon of the upper channel. September finished with an average sales price of $1.710 Million, October ended with $1.714 Million. With just a four thousand dollar increase, we believe the near term top is likely being put in place in order for prices to return lower in order to have another attempt at breaking through that staunch uptrend line.

One of these two lines will have to relent. Given how strong that market has performed and with all the bullish chatter you would think the downtrend has already been broken and new highs are being put in place. That just simply isn’t the truth. As the market weakens, the bulls will say as the market weakens is this is normal after having such a run up, but the run up was technically perfect. Given how a triple top was put in place during 2017 – 2018, we believe the power behind the three year downtrend will be enough to break the decreasing power of the uptrend with each and every impending test. This should come as relief to home buyers but possibly induce some fear sweats for the sellers.

The entry level markets have been rising since the 2nd quarter, as we had written in February for the Michael Campbell’s Money Talks, Insiders Edge. When a large group with a similar mindset descends into a small region, prices will increase. That occurred due to the pulled forward demand to buy a detached property. With Maple Ridge and Port Coquitlam detached markets rising above 1 Million dollars the entry level of the market has been lifted. The high end market has been substantially damaged, with properties selling well below previous expectations.

Pulled forward demand simply means, purchasers who had planned to buy during the upcoming 3 – 12 months became immediate buyers due to the uncertainty of the pandemic, which resulted in most employees working from home and parents becoming teachers. The exodus from the condo market to the detached market was palpable. Inventory has increased over 2,209 since April while detached properties have only increased 484 over the same time period. This imbalance has forced prices in the short term to increase and retest the downtrend. There will come a time when everyone who wanted a house and could afford one purchased.  If the period of strength is coming to an end, what is next?

The growing need to sell is percolating. Largely due to the 11,400 properties purchased during the first six months of 2016, with an average sales price of 1.784 Million. Investors should begin to gear up, as deferred mortgage payments eventually will have to pay the piper, since they didn’t pay the bank. The 11,400 2016 purchasers are praying for continued increased sales resulting in higher sales prices. If prices do not increase and actually decline further the 11,400 number will definitely rise which forces more competition amongst sellers, ultimately pushing prices lower. 2021 will see an incredible increase for the inventory market and this will be met with little enthusiasm as the pulled forward demand has been disbursed.

Eitel Insights believes the 2017 instigated downtrend (orange line) will hold, with a possibility that a minor breakout occurs, followed by a sharp decline. In that instance, the next occurrence will be the inevitable test of the lower line of the long term uptrend (black line). This again, will be immensely important, this time more so for the bulls. Important to the bulls due to what a break of the long term uptrend will likely imply for future data. After the break of the uptrend we would anticipate similar volatile market behaviour, as was the case when the top line of the uptrend broke, which resulted in a loss of 235,000 in just four months.

The immediate and overdone stimulus actually created a temporary windfall for the economy. During the 2nd quarter, Canadian households received 56 Billion from the government while they only lost 23 Billion in lost wages and salaries due to the pandemic (Source Robert Hogue RBC) a net gain of 33 Billion. The additional income when added to the pent up demand during the shutdown and the pulled forward demand resulted in a massive late summer and fall rally for the Greater Vancouver real estate market.

The completed sales came in with another high water mark for 2020, as the oddities for this year continue. Some have exclaimed the 1353 sales as historic highs. Taking a look at the chart you can see that isn’t a true sentiment of where sales are. What is true is the historic high compared to previous October data. This pent up and pulled forward demand has resulted in very unusual activity given seasonal norms.

To recount what has transpired is the easy part. Interpreting what is on the horizon is the hard part. Eitel Insights ability to accurately predict the future based on the technical analysis has been showcased in the past, the current volatile waters will eventually calm. Once the market returns to normal rhythms, the supply demand factors upcoming during 2021 in the detached market look to favour the buyers more than the sellers. 

The governmental factor for BC has changed, while remaining the same. The past three and half years were governed by the NDP coalition with the Green party. The initial reaction to the change in leadership was to break the uptrend (green line) which had propelled Greater Vancouver detached prices higher from 1.184 Million in July 2014 to 1.830 in May 2017. After breaking the growth trend, a sharp downtrend developed (red line) which continually decreased prices until the temporary bottom was discovered in 2019.

This time not only do the NDP have a majority, they seemingly have a mandate. Having the benefit of the past three and a half years as evidence which has resulted in lower prices on average. Add in a historical point of view and which continues to indicate prices decline under an NDP government. Take the 1990’s into consideration. During the last extended NDP leadership prices declined 26% from the top to bottom. Taking the Premier of BC at his words, one could assume the upcoming 4 years will be a challenge to hold prices at current levels, let alone increase from here.

The initial period of weakness began during October 2017 and remained for 21 months. The result of that weakness was prices declined a full 19% which meant a drop of $360,000 over a 21 month time frame. The recent period of strength lasted 13 months from September 2019 at 1.5Million to current levels of 1.715Million an increase of 215,000. In this see saw trending market, the next occurrence after strength is weakness.

The future weakness will likely result from the need to sell, which will heavily impact those who purchased during 2016. The first two quarters of 2016 averaged 1.784Million, and had over 11,400 sales.  Even if, prices stay at current levels these properties will be underwater during their 5 year mortgage renewal period.

Inventory had a pull back during October, again thanks to the properly placed trend line that data has come back to retest the uptrend. With just 4,454 active listings, it wouldn’t take much of the potential 11,400 high priced sales from 2016 to list 2021 in order to change market sentiment.  

As prices hold according to the downtrend, any future price below 1.6Million would produce another test of the lower line prolonged uptrend.

The significance of the two divergent trend lines entering into the apex of a four year trend cannot be overstated. If or when prices break below the lower line of the prolonged uptrend a volatile reaction will ensue.

The previous example of the type of volatility we anticipate, came when the top line of the prolonged uptrend was broken for the last time in July 2018 (upper black line). The following months produced an attempt to regain position above the uptrend which failed, and subsequently sent the average price from $1.705 Million in November 2018 to $1.468 Million by February 2019 a loss of $237,000 in just 4 months.

Rather than being surprised each and every month with a seemingly chaotic data point, allow the technical analysis offered by Eitel Insights to guide you as to why prices move the way they do, and critical trends are being tested by the data. Without accurate trend lines, investors don’t know which time is more critical than inconsequential sideways data periods. The upcoming two quarters of data are of major significance for both the bears and the bulls of the Greater Vancouver real estate market.

Detached Price.png
Detached New Monthly Listings.png
Detached Inventory.png
Detached Sales.png
Has the pent up housing demand been spent?

Eitel Insights featured on Mornings with Simi on CKNW 980

Link to interview: https://omny.fm/shows/the-simi-sara-show/has-the-pent-up-housing-demand-been-spent

A strong return to activity in the real estate market might be about to cool off according to real estate analyst Dane Eitel.  His latest market update predicts the pent up demand from early in the pandemic has been mostly spent, and things will mellow out with the school year now underway. 

Guest: Dane Eitel, founder of Eitel Insights

Host: Simi Sara, Mornings with Simi

Covid-19 Storm Surges Sales Inside of the Greater Vancouver Housing Market

Highs sale numbers and increased prices come as a relief to many homeowners looking to exit the Greater Vancouver market during September 2020. Entry level markets have seen near term highs in prices while the higher end market has begun sell albeit at much lower than expected prices. The beginning of the school year had a major imprint to the 2020 Real Estate Vancouver market. As the colossal impact of the Covid-19th dust continues to settle, we anticipate less ferocious purchasing going forward, as the pent up demand has seemingly been relinquished with the return of the school year.

Diving into the data, the completed sales did occur in higher volume, many of which were for multi million dollars. The high end of the market was very active this month with seemingly money flowing from weak hands to strong ones. A property was listed for 13.388 Million in 2019, cancelled early in 2020 and then relisted during May at 12.998 Million the sale just was achieved at 9.85Million a cool loss of 3.538 Million dollars. Another seller who achieved a sale had been waiting for more than one year. A property that had been on the market for 533 days just sold for 4.7Million, a nice sale price however, the original ask was 6.88 Million in 2018 then 5.68Million during 2019. The eventual sale price was 2.18 Million less than the asking price during 2018. Even while these sellers were bent over the proverbial barrel the high end sales enabled the average sales price to increase to just over 1.7 Million.

Technically speaking, current prices are testing both the long term downtrend and the low end of the upper echelon in the current market cycle. A triple top indicates a market reversal. That triple top occurred over the course of 2016 -2017. That triple top began the overall downtrend orange line that has forced prices lower and ultimately to test the long term uptrend indicated by the black uptrend lines on the chart. Due to the triple top prices did break below the upper channel of the long term up trend during 2019 which sent prices to the upper end of the low echelon. Eitel Insights believes the triple top and subsequent downtrend will again test the prolonged uptrend and eventually break the trend, which will force prices to retest the low end of the market cycle.

The Real Estate Board has been reminding everyone how well sales during September 2020 are doing compared with September 2019, they conveniently leave out that compared to the overall peak (peak price 1.830 Million), prices are still down 7% along with lower sale numbers. Eitel Insights had indicated over the past year or more, any property can sell, however at continually lower levels until the market bottoms likely in 2021 for most areas across Greater Vancouver. The many examples of current homeowners having to chase the market lower will ultimately push prices to retest the prolonged uptrend.

Going forward we believe the demand will dissipate, as that rush to buy land before the school year was a major factor in the recent bump to sales data. The Covid-19 reaction had families moving from condos to a detached property which caused a spike in completed sales. The sales total which is taken from the amount of completions at land titles accumulated to 1325 which is the highest over the previous 3 years. 2020 has changed the way many people work and how youngsters are learning. If a hard second shut down was to occur parents would become teachers again. The desire for the kids to have a back yard to play in has massively increased. With parents knowing this year mattered more than past or even upcoming years we believe that is what drove the completions during September to be the high water market of the current sales cycle. As time wears on Eitel Insights does not believe this type of intense demand will keep up.

The Detached inventory has remained low during 2020 and is still lower than December 2018 data with only 4773 active properties. Contrast that with the Condo market hitting the highest new monthly listings in the past 15 years and the contrast of the two market becomes obvious. The rapid demand for a back yard from young families surely gobbled up many of the newly listed properties.

The overall inventory did not increase for the first time in the past several months, however the new monthly listings hit the highest since in over a year with 2042 newly activated detached listings. As suggested in months past the seasonal norms will likely not hold true for the remainder of 2020.

The previous yearly high water market for new active listings has always occurred before May each and every year except for 2009 and now again, here in 2020. The major difference between now and then…. No 2010 Vancouver Olympics around to corner to ensure construction and the actual economy doesn’t stop, rather than a couple governments offering meager handouts in order to be re-elected.

The effects of the Covid-19 impact is still percolating in the real economy. While yes, offering free money to everyone, whether previously employed or not, is a boon to the economy at the beginning. Longer term, this will mean more taxes. An unwelcome thought for business owners who are already struggling to keep their doors open. Secondary properties are hitting the market in droves already, as the condo inventory hits the highest point in the past 5 years.

In summary, September was a nice bump higher and ideally sellers took advantage, but ultimately, this great data point, in hindsight, will be seen as nothing more than a lower high on the way to the bottom.

Gain actionable intelligence by becoming an Eitel Insights client by visiting our website. www.EitelInsights.com


Detached Price.png
Detached Sales.png
Detached Inventory.png
Detached New Monthly Listings.png
Michael Campbell's Money Talks Radio Interview

Dane Eitel, founder of Eitel Insights, shares his technical and timing analysis with Michael. As well as his forecasts for the bottoms of the detached home and condo markets.

Host: Michael Campbell

Guest: Dane Eitel

Link to Eitel Insights interview

Link to the full Money Talks September 19th Program.

Money Talks.png

Dane Eitel, founder of Eitel Insights, shares his technical and timing analysis with Michael. As well as his forecasts for the bottoms of the detached home and condo markets.

In the Eye of the Storm: Vancouver Real estate Detached Homes

As the eye of the storm is eerily calm, so too is the Greater Vancouver Detached Real Estate market. Largely thanks to historic government stimulus. Just a heads up, the stimulus, draws nigh. CERB is coming to its conclusion, the deferred mortgage program is ending, and evictions have returned, now let’s see where the market will head on its own volition. Hint, down she goes.

The average price for the detached market in Greater Vancouver was 1.638 Million. Technically speaking this is the 20th data point since 2016 that has been around the middle threshold of 1.580M – 1.640M. What that signals to Eitel Insights, is this middle threshold is worn out. With over 30% of the data out of the last 58 data points resulting inside of that narrow 60 Thousand dollar band. Our interpretation of these multiple clusters is that prices have exhausted the middle threshold. The next challenge to the Greater Vancouver market will be to find the market bottom (likely at 1.40 Million during 2021), then consolidate that base price. Once that market has accomplished these herculean feats, prices will begin to rise. After the base, Greater Vancouver market will begin to climb, the middle threshold will be broken like water going through a tissue. As there have been multiple test of the threshold on the way down there will not be much need for sustained price tests on the way back up to the peak echelon.

Inventory has continued to grow, and August resulted in 5000 active listings. The highest level in the past 10 months however was still staunchly lower than the 15 year average of 6000 actives. At the current levels the inventory has 2000 less properties than 2018, but the average sales price is only 13 thousand dollars higher. That implies not too many are choosing to be selling their property during this time. The properties that are on the market are more than likely “need based sellers”, which as Eitel Insights has forecasted will continue to rise. One example of why there are less sellers than two years ago. The market was still considered by other analysts to be a hot market, listings were high as Realtors told sellers they could name their price and a buyer would pay it. That possibility never actually transpired, what did occur was a cancellation many listings, based on the Realtors advice that next year will be better, wrong again. Here is one example property out of many examples had listed for a pie in the sky price during previous years. A property listed in 2018 with a 1.658 Million list price, never sold, relisted in 2020 at 1.378 Million and sold for 1.285 Million. Want another example? Here you go, 2017 list price of 5.288 Million, 2019 list price 4.788, price reduction down to 4.388 Million, another reduction to 4.25 Million. 2020 list price 4.099 Million, sold for 3.80Million.

Would either of those properties have continued to chase the market lower unless there was some kind of a need to sell? I doubt it. This need to sell will continue to permeate throughout the detached market.

Sales ticked lower in August with 1108 sales, compared to July which had 1134. With the sales escaping the identified channel the past two months, we anticipate the data to return lower as the economy will be on its own, without the aid of any government buoys. The government did everything to halt the economic impact of Covid-19 across Canada, especially in the two largest real estate markets (Toronto & Vancouver) now that the government’s intervention in to the free market is coming to the end. The forthcoming data will continue to under deliver in upcoming quarters, now that folks have to go back to spending money they earn rather than spending the handouts.

After the anemic sales during April and May, the sale surge during July and August, should not come as a huge surprise. Taking all of the past 5 months of sales into consideration, April 393, May 544, June 873, July 1134 and August with 1108, the average is 810, when compared to the previous 2 years the average is good. However as you will remember, Eitel Insights has stated this market has been falling off since peaking in 2017. The 5 year average of sales during the 5 month span is 1163 sales indicating the 810 to be less than stellar.

Yes, we are aware that interest rates are low, but now that the governments have moved off of the standard 2% inflation target, I do not see any real panic to lock in the rate before they soar higher, do you? If you don’t, we suggest to practice patience and look to accomplish a sale at a lower price point with more selection during 2021.

Eitel Insights has offered 2021 as a target to purchase since 2017, unlike all other analysts who have flipped flopped over themselves in the past few years, we remain staunch due to our ability to block out the noise and stick to the analytical interpretation. These ever changing fundamentals that most pontificators speak on are on data that transpired a quarter ago at least, this data is tainted with the CERB and other unusual stimulus. Those fundamental negative results will not be seen until 2021, then they will say the sky is falling after it already fell.

Real estate need not be, buy, and close your eyes. With Eitel Insights we open your eyes to the possibility of tackling the largest purchase of a life time with unemotional analytical interpretation, along with a history of accurately forecasting various markets across Canada.

To become an Eitel Insights client and be able to accrue actionable intelligence through our analytical interpretation, visit www.eitelinsights.com

Detached Price.png
Detached Inventory.png
Detached Sales.png
Eitel Insights featured: Vancouver housing analysts disagree about overall impact of COVID-19

VANCOUVER (NEWS 1130) — The same week B.C.’s finance minister said housing sales dropped a whopping 45 per cent because of the pandemic, some real estate watchers say the situation isn’t so bad, but others are convinced it will take several months for the Metro Vancouver market to rebound.

Carole James says prices fell four per cent between February and May, but Michael Ferreira who is the managing principal of Urban Analytics (which tracks data for developers) says prices are already coming back up.

“We may have weathered the storm pretty well and may not see much change in terms of pricing and given what’s happening in the new home market, a lack of new supply over the last two years could be seeing a different story in two years as far as upward pressure on pricing again.”

He says there’s no doubt the real estate sector has suffered during the pandemic, but it could have been worse.

“You would have expected with COVID that prices would have dropped, but we saw supply drop right off, demand get sustained –especially in May and June. Without that supply there, create situations where you have multiple offers again and puts that upward pressure on pricing.”

However, Dane Eitel with Eitel Insights predicts prices will continue to drop until at least next year.

“The truth is the inventory is rising. The condo market had 2800 brand new, active listings in the month of June. That was the highest month since 2012. There’s not a pent up need to buy, but there is a pent up need to sell.”

He adds sales in May were the worst they’ve been in 15 years with only 325 more detached homes and 450 extra condos sold in June.

“The inventory in the detached market grew more than 700 and the condo market grew over a thousand from the previous month, so you tell me where is the pent up demand?”

Eitel tells NEWS 1130 his research shows there’s more inventory now than there was eight years ago, so it could take several more months for prices to start climbing again.

“Most markets in detached properties will be in 2021, the condo market will likely be in 2022, so we will eventually be positive about this market, but as it currently sits, it’s very difficult to be an optimist, unless you’re a real estate activist. You’re not really acting as an analyst.”

Ferreira insists the situation has significantly improved since the last week of May when the lockdown was lifted.

“We certainly saw an uptick in sales. Even though it’s lower than the ten year average, we were still significantly higher than we were last year, as far as sales go.”

Ferreira also tells NEWS 1130 some owners of short-term rental properties may not be able to wait for the borders to open up, so they can book guests from other countries.

“A lot could pivot and switch that over to a long-term rental, so that’s an option that they have and I know, some probably already have because we are seeing a bit of a dip in rental rents. That could be a combination of –a function of more supply coming into the market as the result of some of those AirBnB units getting converted to longer term rentals, as well as a drop in the immigration, so you don’t have all the international students that would typically come and be renting product at this time –getting prepared for the school year in September, so the combination of those two probably softens the rental rate market a little bit. Certainly, there are some that might decide it’s not worth the hassle, so I’m going to put it on the market, but to date, I don’t think we’ve seen huge evidence of that so far.”

Even so, he admits what keeps him awake at night is what happens if there’s a second wave of the pandemic and the economy shuts down again.

Eitel insists some buyers are already taking their time because they’re worried about paying too much for something they can get for a better price next year.

“That is a fear of overpaying for a depreciating asset, so into 2021 when prices are attractive, buyers will be fearful that prices will continue to go lower and that will be a tragedy for those that miss out on this historic opportunity upcoming. Some sellers are seeing that they will need to sell, but praying and holding on for dear life that won’t come to fruition, but eventually it will. In 2021, you will see the roll out of foreclosures and that’s where the investor mindset starts to change and starts to purchase properties at a discount. And, that will force the average sale price lower because no longer are they looking at mansions that were selling for $17-million and actually selling at $12-million. They’ll be looking at properties listed for a million and maybe selling for $800-thousand.”

Despite warnings from Eitel, the president of Pilothouse Real Estate Inc says Metro Vancouver is so “desirable,” most people born and raised there can’t afford to buy a home in that market.

Vince Taylor, who specializes in pre-sale condos, insists demand is still stronger than supply.

“Just like you can’t live in Manhattan. You got to go live in Brooklyn. What we’ve done is created such a magnificent corner of the world, it is really hard to live here. This is one of the greatest cities in the whole world and real estate will be priced here accordingly.”

He’s also suggesting prices will go up when thousands of immigrants rush here once non-essential travel is allowed again.

“And in fact, there’s an enormous influx of people waiting to come to Canada –Vancouver in particular, but they can’t come because the airport is closed. This is the time when the professional real estate buyers are buying. When the airports open, prices are going to go crazy.”

Taylor agrees some owners –hoping to capitalize on short-term rentals for companies like AirBnB– are selling off those properties or turning them into long-term rentals which helps explain why vacancy rates are climbing in parts of Metro Vancouver.

However, he says he doesn’t believe many people will be forced to sell their homes because they can’t afford to cover their mortgage or they’ve lost their jobs during the pandemic.

“Add that to what’s going on in Hong Kong, you’re going to see about 80-thousand people arrive in Vancouver –one of the safest, most beautiful, world-class cities with no supply. If you don’t have many apples and you’ve got lots of people that want apples, the price of apples goes up.”

On Tuesday, the provincial government predicted a $12.5 billion deficit linked to the pandemic with Finance Minister Carole James saying, “This could be the worst downturn experienced in our province in recent history.”

Written By Marcella Bernardo News 1130 CKNW City News

The Devil is in the Details, Greater Vancouver Detached Market Update

June sales increased along with the average price, major win for the bulls? Not even close, the headlines can be deceiving. Once you take deeper dive the recent data is very bleak. The accepted offers in June 2020 are the lowest June in the past 15 years. Homes sold for a higher price than the month before but, for the first time in a quarter, and only up 2% from May.

Even during a downtrend the prices will create higher low data points while still trending lower to find the bottom. Some have stated that the Corona Virus shut down will create a pent up demand, I hope this isn’t the demand they were anticipating because it’s a blip on the charts.

The average sales price for June came in at 1.619Million, signaling the first positive data point since February. July will be hugely important in setting the next short term trend for the Greater Vancouver price chart. If the July is lower than 1.619Million there is a strong likelihood that a new aggressive downtrend will be established. The possible downtrend is indicated with the yellow downtrend marker. We have purposely used yellow at we need confirmation before the downtrend is established.

One anticipated trend that we have spoken on before is now coming to fruition, that being, the high end market is selling more readily than the lot value properties. Buyers are wanting the most bang for their buck and as a result they want the 17Million dollar mansion for 12Million and one such sale took place in June. Not too many buyers are purchasing spec land, this has an effect on the average price. Which means once those foreclosures roll in, and investors begin to dip their toes in the water. That will shift the focus from trying to buy the high end on the cheap to buying homes near lot value.

This also indicates that even while mansions are selling for very high numbers, the average price is still in the middle of the market threshold. Once the foreclosures hit and inventory is high, investors will begin buying deeply discounted lots which will force the average price to further decline. Then the market will panic, but in reality, the investors buying lower valued properties will indeed force the prices to drop but simultaneously be creating the market bottom. The pricing bottom will likely occur at 1.40 million if this threshold breaks we look to 1.225Million as the next threshold.

Detached Sales could be interpreted as “six of one and a half dozen of the other”. Simply meaning you will hear likely hear that the June 2020 sales were the highest over the preceding two year. Technically true, but the June 2020 sales was the lowest excluding the previous two year over the previous 15 years.  Don’t let the language fool you when you hear best June in the previous two years. The past three years of June sales data are the lowest in the past 15 years. Not a great trend to be a part of yet Realtors and the Real Estate Boards will likely tout this as a win.

Another truth even though it may hurt some, the pricing peak for the market occurred in 2017, However sales numbers began to tank substantially since the frenzied mentality of 2015 & 2016. Sales numbers have not exceeded 1000 since June 2017, while the average over the previous 15 years is 1050. The reality is the Greater Vancouver detached market has been trending lower for many years already, while most analyst and definitely the GVRD real estate board been saying we were nearing the end of the tunnel by being able to see light in 2019… Eitel Insights warned that the light was a train, not the end of the tunnel.

Last truth, we know sales are from previous months accepted offers. The accepted offers in June 2020 were only 561 and the absolute lowest June in the past 15 years. For context June 2019 accepted offers were 804, June 2018 were 755, June 2017 were 1,216, June 2016 were 1,446, June 2015 were 1,816. So much for best in the past 3 years, Eh?   (Happy Canada Day)

Sales are not good nor are they average in fact they are paltry, inventory is on the rise and will continue into 2021. None of this bodes well for prices in the short term.

Inventory finally surpassed 4200 active listings which hadn’t occurred since December 2019. The inventory currently sits at 4471. Once the mortgage deferral system comes to an end the inventory will rise rapidly.

Over the upcoming year an odd phenomenon will occur to the buyer’s mindset. Far from the chaos of 2015-2016 when frenzied buyers lined up and fought over who would pay the most in history for a home. Into 2021 a whole new kind of methodology will prevail, the fear of overpaying for a depreciating asset. When inventory is at the highs prices will be at the lows but purchasers will be fearful when they should be strong.

All that said, purchasing when a market is actually at the lows of the cycle is a great idea .Eitel Insights will be releasing a full market analysis for Greater Vancouver in the upcoming week. We proudly announce that Eitel Insights will be promoted by Michael Campbell’s Money Talks. In this report we analyze all 20 markets inside of Greater Vancouver and update the data monthly so you can know exactly when and where the opportunities reside, which are currently rare but do exist right now. 

With our newest product release you will know exactly where each market inside of Greater Vancouver is with respect to the individual market cycles, for prices, inventory, sales, moving averages, strength index, and our unique supply demand chart. Use our analytical interpretation for your actionable intelligence.

Not all markets in Greater Vancouver are created equal, some areas are closer to the bottom. While others still have significant percentage losses upcoming. Become an Eitel Insights client to find out which are which.


Detached Price Chart June.png
Detached Sales Chart June.png
Detached Inventory Chart June.png
Prices are Down, Sales are Way Down, and the Horizon Looks Ominous.

Money Save is Money Earned.

May 2020 will be remembered as the month CMHC finally turned negative. They stated the two major markets in Canadian Real Estate will be going lower for the remaining portion of 2020 and into 2021. Something Eitel Insights has been stating correctly since 2017. The CMHC forecast sounds very familiar if you think about it.
Eitel insights stated in 2017 prices had peaked and would decline until 2021 dropping from 1.830Million to 1.4Million. In 2018 we stated, if 1.4Million does not hold as a bottom then as low as 1.225Million would be tested.
The CMHC forecast as of May 2020 calls for a 9% - 18% drop. Interesting, since the average sales price in Vancouver was 1.6Million that would put their forecast at 1.45Million for 9% drop or 1.3Million at an 18% drop. Just a bit of a rosier colour than our forecast offered years ago.
The exactness of Eitel Insights forecasts been unmatched, while others have continued to flip flop their positions, we have remained true.


Greater Vancouver detached prices in May dropped to 1.585Million which is the middle threshold of the market cycle. Seemingly breaking the uptrend that has been prevalent since September 2019 and instigated with an average sales price of 1.5Million.
CMHC tightening the purchasing restrictions for mortgages with less than 20% down will only perpetuate the tough market conditions. With the old normal, prices were in decline, and our new normal is not very promising. Prices will continue to search for lower prices as the market goes forward. We do anticipate a test of 1.4Million in 2020 with 2021 confirming the market bottom.
Gone are the days of 10 year outlooks, Eitel insights has advised potential purchasers to steer clear from buying at the market peaks. To date over $245,000 (from 1.830Mil – 1.585Mil) saved if the temptation to purchase has been resisted through our analytical interpretation. The 10 year outlook, if purchased in 2016 after 5 years will be down by $430,000, once 2021 realizes the 1.4Million forecast. Meaning your investment is negative, which forces you to put more time and money into an asset that is underwater.
Once the bottom is confirmed by our analytical process, prices will begin to increase back up to the old market high and beyond. This is how Eitel Insights clients invest, we analyze and observe, and then step to the plate buy at the low echelon of the market cycle. We cannot wait to offer the opportunity to make money in the Real Estate market rather than saving you money like we have been, but remember, money saved is money earned.


Sales are the headline, with only 544 detached sales taking place at land titles in May 2020. The accepted offers in May were only at 525. Which has been quoted as a great number compared to 370 in April and true enough but beating a lame duck doesn’t make you a champ.
Let’s take a look at the past 5 years of May accepted offers. 2015 had 1837, 2016 had 1820, 2017 had 1503, 2018 had 839, 2019 had 839, and of course we just had 525 accepted offers last month. This epitomizes what we have been try to explain would transpire. After peaks comes valley’s. The peak was frenzied, the bottom will look deserted. We advise purchasing during the desertion, while there is copious amounts of inventory and prices at the lower end of the market cycle.
The historically low sales numbers experienced recently, are occurring during the usual peaks, you can imagine what the sales number will look like during the seasonal market lulls.


Inventory has hit an artificial ceiling of 4200 active listings across Greater Vancouver. This number has been tested twice thus far. Once the 4200 level is broken we anticipate the next levels to be broken with relative ease. The upcoming levels are 4500 and then of course 5000, at the 5800 level the market will meet up with the 15 year average.
One interesting point on the chart is the high levels of inventory during the market peak of 2017 was the seller’s choice to trade their property for an all-time high sale price. This upcoming high level of inventory will largely be out of need to sell. These upcoming sellers will have a very different modus operandi.
Once inventory return to normal levels which will inevitably occur, we anticipate the downturn in prices to return with gusto bringing the average price down an additonal $185,000 lower than the current price.


Again, Eitel Insights has saved a potential purchaser $245,000 to date with more savings on the horizon. Stick with the industry leader, since inception Eitel Insights have led all contemporaries.


Not all markets in Greater Vancouver are created equal, some areas are closer to the bottom. While others still have significant percentage losses upcoming. Become an Eitel Insights client to find out which are which.

Detached Price Chart June 2020.png
Detached Sales Chart.png
Detached Inventory Chart June 2020.png
Eitel Insights Interview with Simi Sara 980 CKNW

Chapter 1: It's a bleak outlook for homeowners, and there's a real concern about the foreclosures that will likely result from it. Guest: Dane Eitel, founder of Eitel Insights. Chapter 2: With restaurants, salons, and shops reopening this week, some are charging an extra fee.

https://omny.fm/shows/the-simi-sara-show/outlook-for-homeowners-bleak-charging-a-covid-tax?t=39s

It’s a bleak outlook for homeowners, and there’s a real concern about the foreclosures that will likely result from it. 

Host Simi Sara 980 CKNW

Guest: Dane Eitel, founder of Eitel Insights.

Don’t Try to Catch This Falling Knife

Greater Vancouver’s Detached Market Drops Over 100 Thousand dollars in April.

Sell in May and go away, an adage used primarily in the stock market, applies to Vancouver’s Real Estate in 2020. In all actuality one should have sold much sooner than May, but better late than never. Home values dropped over 100 Thousand dollars from March to April across Greater Vancouver. With more significant losses forecasted.

Many analysts and even the Greater Vancouver Real Estate Board had touted a significant price increase for the detached market in 2020. Reality has hit them all hard, along with their ardent followers. Prices are still up from the beginning of the year albeit only a measly 7 thousand dollars. From $1.590Mil in January to 1.597Mil in April. Signalling the peak of the 2020 detached prices has already come and gone.

Eitel insights had strongly suggested selling into that perceived strength, and advised to hold off on any potential purchases. The chart above demonstrates why. Prices for a majority of 2019 were near the 1.50Million threshold (Higher Orange) which held as a temporary bottom, and in turn stabilized the market enabling a rally up to 1.709Million to occur in March. We have seen this movie before of pricing threshold temporarily holding only to be broken on subsequent tests.

During 2017 – 2018 prices tested the 1.60Million threshold which temporarily held. However a pricing threshold is akin to a camel, one added straw will break this markets back too. 1.60Million broke early in 2019 much like 1.50Million will break in 2020. Leaving 1.40Million as the next threshold inevitably tested.

Now, we advise, Don’t try to catch this falling knife. Prices are down over $230,000 from the peak which is good. It will become even more attractive with time. As prices decline to 1.40Million that will exemplify a discount of $430,000 to the market from the peak. 

There is no rush to enter this market, we suggest patience.

Inventory for the month of April waned as expected due to covid – 19, and the social distancing. The active listings are still above the staunch uptrend, finishing the month with just under 4000 properties for sale.

Once the social distancing relinquishes, the inventory will rapidly rise. A need for money has become a harsh circumstance for a majority of households. The stock markets have lost the equity gained over the previous two years. There isn’t even a possibility to work extra hours, as most work places have been closed, some never to reopen.
With few options remaining, selling real estate will become an unfortunate necessity. Which will inevitably lead to foreclosures coming to the market as well. None of which puts pressure on the buyers. If selling, take the hit early before the knockout punch is landed.

The housing market just experienced the lowest sales in April on record. For some perspective during the 08 -09 recent recession the sales for April were at 1298 and 1188 respectively. Sales numbers plummeted to only 393 home sales in April. Sub 400 sales have only occasionally occurred during the winter months, never in the spring markets. Sounds bad but there is an additional kicker.

As we have been pointing out for the past few articles, sales data is from land titles, meaning, the upcoming months will see likely even lower numbers reported.
The number of accepted offers so far this year, beginning with January, was over 500. February saw nearly 800, and March realized just under 700. Meaning the sales data from land titles of 393 sales came from completions on those previously accepted offers.

The kicker, April’s accepted offers were just over 200… the worst is yet to come.  

One of my favourite quotes is as follows which will lead into my final thoughts. “While the individual man is an insoluble puzzle, in the aggregate he becomes a mathematical certainty. You can, for example, never foretell what one many will do, but you can say with precision what an average number will be up to. Individuals vary, but percentages remain constant. So says the statistician.”  - William Winwood Reade

Eitel Insights’ forecast of 1.40 Million was published in 2017 (Western Investor). Not only were we the first to forecast the peak of 1.830 million, we forecasted the bottom at the same time. The housing markets are no longer guess work. Fundamental factors continually show up late to the game. By utilizing our actionable intelligence buying low and selling high is no longer based on a gut feel, it is technically predictable. 

Not all markets in Greater Vancouver are created equal, some areas are closer to the bottom. While others still have significant percentage losses upcoming. Become an Eitel Insights client to find out which are which.

Detached Inventory Chart.png
Detached Sales Chart.png
The Good, the Bad, and the Ugly Truth about Greater Vancouver's Detached Market.

There was Good News economically speaking during the tumultuous month of March 2020. Of course this will be remembered for the major breakout of the Corona Virus. However, for those who sold their detached homes, it will be remembered for achieving the highest sales price since June 2018. Basically receiving similar price points as during the end of the frenzied Real Estate Market.

Notice on the chart, the detached average sales price in March came in at $1,709,750 testing the upper echelon of the current Market Cycle.

The Bad News, this will not be a long lived reality. Prices will be coming off with gusto in the upcoming months. Again notice on the chart in the text box, Eitel Insights anticipates the market to test the 1.4 million pricing threshold during 2020. At that price point the market would have corrected a total of 23% from the peak and down 16% from the latest data point.

For the 1.4 Million average sale price to become a reality the uptrend which began in July 2019 at 1.494 Million would need to be broken (Green uptrend). Additionally a breaking of the prolonged uptrend established in 2008 at $750,686 Black Prolonged Uptrend). The 1.4 Million price point would bring the data to the lowest orange line in the current Market Cycle.

The ugly truth, a 1.4 Million average sales price is our base case (23% correction from peak), the possibility of the market going even lower is tangible. In that case Eitel Insights would look at 1.225 Million (33% correction from peak) as the next major resistance level.

Good News, the buyers who have look but not touched, will be rewarded with ever lowering price points. Along with increased inventory to choose from.

Bad News, the sellers who chose the two birds in the bush rather than the one in the hand will inevitably chase the market lower, continually searching for those darn birds.

The sales numbers for March 2020 will be shocking until I explain. There were 862 sales in the detached market across Greater Vancouver. Which puts the market technically near the high mark of the current Market Cycle.

The explanation, technically there were not 862 sales in March, there were however 862 completions. The way the REBGV counts the sales data is not on accepted offers in the month but rather on deals that have completed at land titles. Meaning the 862 sales occurred in different months but the key exchange took place in Mach.

Point of interest the price points are taken from the accepted offers in that particular month, while the sales totals are from previous months accepted offers. An odd fact but worth point out from time to time. This also means the upcoming months of sales numbers could continue to be higher than the actual activity transpiring.

The inventory onslaught is assuredly on the way. As Eitel Insights has been advising for the past quarter or more, is to beat the crowd. Sellers who listened had achieved the highest sales price in the previous 21 months. While prices will not continue the uptrend, the prices now have to be better than what will be offered in the upcoming months and year(s). We advise home owners to be observant of their current situations, play out our base case of a 18% (correction stops at 1.4 Million) decline to your home’s current value. Add in a possibility of the market correcting an additional an 28% (correction continues to 1.225 Million) from here. If either of those realities put you into foreclosure, sell now get out with your skin, and put the money in the bank. If you see the train coming at you, merely get off the tracks.

Another thought, if the idea in the upcoming years is to downsize. Sell now, achieve the highest price you can, rent for a couple years. Then purchase the Condo when the market is at the lowest price point in 2022. This is the best situation to be in as the market sits right now. Nothing wrong with selling high and buying low.
Not all markets in Greater Vancouver are created equal, some areas are closer to the bottom. While others still have significant percentage losses upcoming. Become an Eitel Insights client to find out which are which.

Detached Price.png
Detached Sales.png
Analytics Prove Their Worth Yet Again in Vancouver’s Real Estate Market

Eitel Insights continues to outperform the competition. Not a single time have we suggested purchasing a detached home or condo property. On the contrary, we have been suggesting selling into this short lived reality of optimism. Most every other analysts said 2019 was the bottom. 2 months into 2020 they are running scared. Eitel Insights has never wavered from saying the market is going lower for longer.
Eitel Insights uses Technical Analytics to provide actionable intelligence to the market. Fundamental analysts will never catch a “Black Swan” because they need the event to occur before they see the ramifications. Technical Analysts use metrics to show that the market is at too lofty of a position and a correction is upcoming. Just like we did during 2017.
The latest Black Swan no one saw coming is the Stock Market recession and the Corona Virus. Now Eitel Insights did not have a name for these events, however we did state that the technical showed further losses upcoming.

The detached market currently sits at 1.6 Million on an average sales basis. Down 13% from the peak in 2017 or -$230,000. As we have advised our clients this current market cycle will test 1.4 Million in 2020 which would be a total correction of 23% or -$430,000 from the peak. If that does not hold firm the next echelon tested will likely be 1.225 Million.
Here is a quote from the Eitel Insights update last month “We advise to the sellers who will be in that need based situation begin to sell now before onslaught of similar stories hit the market. Need based selling will become necessary in 2020, propelling the market lower in price. Simultaneously the buyer’s trepidation will skyrocket. The only way to mitigate their pessimism will be time. Which is not something every seller will be able to afford in the upcoming market. ”
We certainly hope you took our advice in the last instalment. If you disregarded it and purchased based on the recommendations of the "usual advisors", looking at the chart notice the whipsaw effect you are in now.


The sales totals from February for the detached market were 686 in Greater Vancouver. We have projected a sales threshold which has an artificial top around 950. Given our new reality, we believe the artificial top will hold firmly in place until the market correction is over.

While inventory still came in on the light side with only 4100 active listings. The numbers are continuing climbing from previous months. Now with the stock market crashing and over 400 Billion dollars lost in the TSX. Expect to see hard assets begin to be sold off. The housing market will definitely feel this impact. We have been stating 2020 would begin the onslaught of foreclosures to date there are 49 foreclosures. Expect that number to rapidly rise by the end of the year, as we predicted.

The one shining light of this dreary market is that the properties that are selling, are selling in quicker time. Properly priced listings have been getting sold. We had said list before the onslaught. While the onslaught appears to be on us; listing sooner rather than later offers a chance to receive a higher priced sale. As the time continues to pass and the inventory builds up, prices will decline further. For some it could be list now or have the bank list it for you in the upcoming future.

Not all markets are created equal while some fall other rise. Become an Eitel Insights client and receive Actionable Intelligence on Real Estate across Canada

Detached Price.png
Detached Inventory.png
First Data of 2020. Detached Market Update

The first data of 2020 is in; the averages sales price for Greater Vancouver is down $80,000 from the previous month, and down $40,000 year over year. No sense for optimism from where we sit.


The price point is in the middle of the current market threshold. After a successful defense during 2019 of 1.5 million, Eitel Insights anticipates the next test of 1.5 million will break through and prices will indeed test he 1.4 million threshold. Previously established in 2015. At that point all equity gained over the previous 5 years will be erased.


Sales are significantly lower than a quarter ago. Of course, there is a seasonal factor at play and the 444 sales were higher than the previous January when only 344 detached homes sold.


We feel a need to point out what occurred during 2018 and 2019 for the sales activity. In 2018 the stress test was introduced which diminished purchasing ability by 20%. That forced a major segment of buyers to the sidelines. In 2019 prices had indeed dropped to 1.5 million which is 18% from the peak in prices. Basically nullifying the stress test for the first time. It took the market dropping 18% for purchasing to begin. The 2 year backlog of buyers meant pent up demand that was finally able to release in 2019.


The current prospective purchasers are in a wait and see mode. We anticipate the sales numbers to again jump once the market reaches stress test mitigation. The Market sentiment will also begin to turn further negative as the introduction of the need based seller becomes prevalent in 2020.

The Inventory numbers have hit their lows and will begin to rebound during the upcoming spring and summer markets. Eitel Insights forecasts the detached inventory will again return above the 6000+ active listings by the beginning of the 2020 school year. Current inventory levels in January were 3947 the lowest amount since February 2016.

The notion that the demand has eroded the inventory is a fallacy. The inventory had dried up due to seller’s fatigue. Much of the inventory had a listing that was at expiration and rather than relist they took the 4th quarter off. After that time off, still with a need to sell, propelled on by the hyped sales numbers reported by the board… Inventory will be loaded soon enough.


We advise to the sellers who will be in that need based situation begin to sell now before onslaught of similar stories hit the market. Need based selling will become necessary in 2020, propelling the market lower in price. Simultaneously the buyer’s trepidation will skyrocket. The only way to mitigate their pessimism will be time. Which is not something every seller will be able to afford in the upcoming market.

2019 Greater Vancouver Detached Recap & 2020 Forecast
Detached Price.png

A 90 thousand price increase from November to December! How? The one word answer is, Pemberton. Pemberton’s average sales price doubled in value over the one month. November had an average sales price of $695,000 then boom, $1.340 million, however this was the only sale and hardly a trend.


Greater Vancouver’s December average sales price came in at $1,670,893. Which is actually up from the beginning of the year when January realized a sales price of $1,615,953. However if you subtract the doubling of Pemberton and add a normal sales price for Pemberton the Greater Vancouver average comes out to $1,580,714, which would have resulted with the average sales price remaining close knit with November’s sales price of $1,583,878.

Detached Sales.png


The 2019 yearly average sales price for Greater Vancouver Detached market was finalized at $1.565 million. Signalling a drop of $115,000 from the 2018 average of $1.680 million.
Eitel Insights anticipates 2020 will be another down year for sales prices, we predict prices to test the $1.4 million threshold. At that point, all equity that had been gained over the previous 5 years will have been erased. Also when the market tests $1.4 million that will realize a 23% loss from the peak in 2017 of $1.830 million. If 1.4 Million does not hold as a bottom the market’s next echelon will be $1.275, then $1.225 million. That is as low as we could see Greater Vancouver falling to by 2021 which would signal a 31% price correction from the peak.

Detached Inventory.png


In 2015 the average sales price broke the $1.4 million price point. By 2017 prices had escalated to $1.830 million, signalling an increase in equity to every home owner of $430,000.  With that kind of whipsaw to the market, we will see a lot of “need based selling” upcoming in 2020 and 2021.

The sales in 2019 broke out of the falling knife trend that had been established in 2016. Rather than the market rebound touted by the Real Estate Board and other analyst, the rationale for purchasing was simple… stress test mitigation. With multiple price test of $1.5 million signalling an 18% price correction from the peak the sidelined purchasers who had been effected by the stress test were able to purchase for the first time in years.


The sales range held firm in 2019 with 950 holding as the most sales in a given month, which is amazing given we started the year with only 344 sales. We anticipate the 2020 market to again test the 950 high water mark.


Noticeable in the chart is the drastic difference between our new reality compared with the scorching hot market that greater Vancouver had become accustomed to.

The inventory finished 2019 at the lowest levels since January 2016. With only 3527 active listing in December 2019.

Detached DOM.png


The 2016 levels were based on incredible demand from local and foreign investment.

2019 however we see as merely seller’s fatigue. The market has been evolving to a buyers’ market over the past two years and the seller’s can feel the change. After remaining on the market for months and no offers we believe a majority of the sellers took the Holidays off. In the first half of 2020 the market will again experience a new crop of inventory that will hit the market and push levels back above 6000 active listings.

An example of why sellers have given up, the Days on Market is at the highest point over the previous 6 years. Long gone are the days when a listing would sell in one weekend with multiple offers. However sharp listings still do sell in a reasonable time, which was true in 2019. The unfortunate side of that statement is there are increasingly fewer sharp listings.
As this market continues to push lower the purchasers are keenly aware. They will bide their time and be rewarded with increased competition amongst the listings for their valuable time and consideration.

Not all markets are created equal while some fall other rise. Become an Eitel Insights client and receive Actionable Intelligence on Real Estate across Canada