For the first time in 5 years the two heavyweights of the Canadian housing market have broken above their previous peaks. Both real estate market values are now in uncharted territory, implying a new growth cycle is in its infancy. The new highs created in February were $1.869M in Greater Vancouver & $1.684M in Toronto. For the home values to remain in growth territory it is likely that prices will stay in close contact with their uptrends which have supported prices to their current lofty levels.
However in Greater Vancouver the supportive uptrend is close to perpendicular. Such aggressive trends are challenged to hold in place for very long. Implying the recent $267,000 price increase over the 7 months is not a sustainable growth pattern. In the City of Toronto values have risen well above the long term uptrend which instigated during the creation of their market cycle low. In the past 3 months alone home values have shot up a dramatic $208,000 according to the average sales price, which is again a nearly impossible trend to persist for any length of time.
What spurred on the torrid price increase, in the middle of a pandemic? The instant increased demand for a larger building footprint was very apparent. More importantly but less obvious was the banks ability to issue new mortgages to the increased applicants. This was enabled due to the Mortgage Bond purchasing Program (CMBP) introduced by the Bank of Canada (BoC) beginning in March 2020. The Bond purchasing Program enabled the BoC to purchase up to $500 Million in secondary Mortgage Bonds per week. By July there had been over $6.2 Billion of mortgage bonds bought on the secondary market.
The Bank of Canada routinely purchases Mortgage Bonds to balance there assets. However they historically have solely bought Mortgage Bonds on the Primary market. The creation of CMBP was so the BoC could purchase on the secondary (resale) market.
Why did the Bank of Canada step in and purchase on the resale market for the first time? Simple answer is, no one else would. That would have left the secondary market dealers with their hand full of existing mortgages on their balance sheets, in turn the banks books would have remained full. That would have led to much tighter mortgage funds available, during the influx in applications. The Bank of Canada jumped to action and “supported normalized markets”. The odd thing is, the amount of funds offered to the mortgage market during the pandemic compared to the governments relief to other sectors. The amount of secondary Canadian Mortgage Bonds purchased was two times larger than the Canadian government COVID 19 support for individual sectors. For comparison sake, $8 Billion to support the mortgage market but the entire Air Transit Sector received $331Million.
The guarantee that the Bank of Canada was going to “support normalized market functions” to the tune of $500M per week, during a abnormal period of time, created a no fear environment for both the secondary mortgage market dealers and the major Canadian banks.. The banks newly found confidence, coupled with historically low interest rates created the environment for recent insane price increases of $267,000 in Vancouver and $247,000 in Toronto over the course of just several months. Even as homes values were increasing $100,000 or even $200,000 over the most recent comparable, mortgages were approved with ease. The Canadian Bond Mortgage purchasing Program came to its conclusion during October 2020 after expending over $8 Billion.
As the potential free fall of the mortgage bonds was not allowed to take place, an artificial floor was created by the BoC. The creation of the bond market floor encouraged other investors to step to the plate since the entire Bank of Canada would essentially need to collapse in order for the mortgage bond resale market could go any lower. Akin to the 08-09 recession when the US Federal Reserve said that some banks will not fail, as they did with Bank of America, the stock was in free fall until that announcement. Similarly when the secondary mortgage market was positioning for further losses, the Bank of Canada said real estate will not fail.
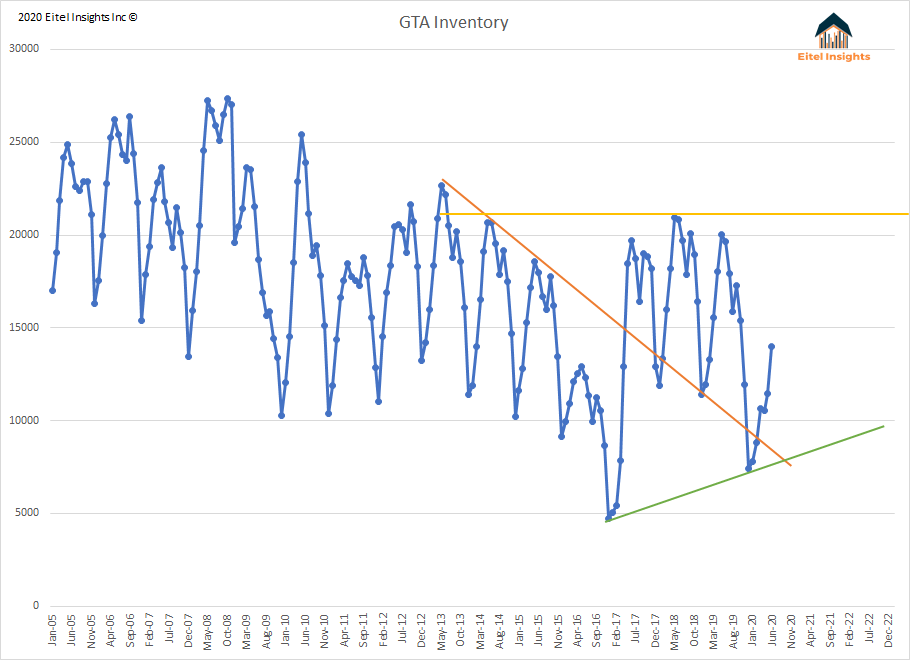
It wasn’t as if home values were down immensely already and could not withstand further losses. The Greater Vancouver housing market was around $1.6M (-12% from peak) during January - July 2020. The market cycle low already been established during early 2019 when home values had dropped to $1.486M (-20%) from the 2017 peak value of $1.830M. Without the 8 Billion influx, the market would have found it near impossible to have achieved the current values.
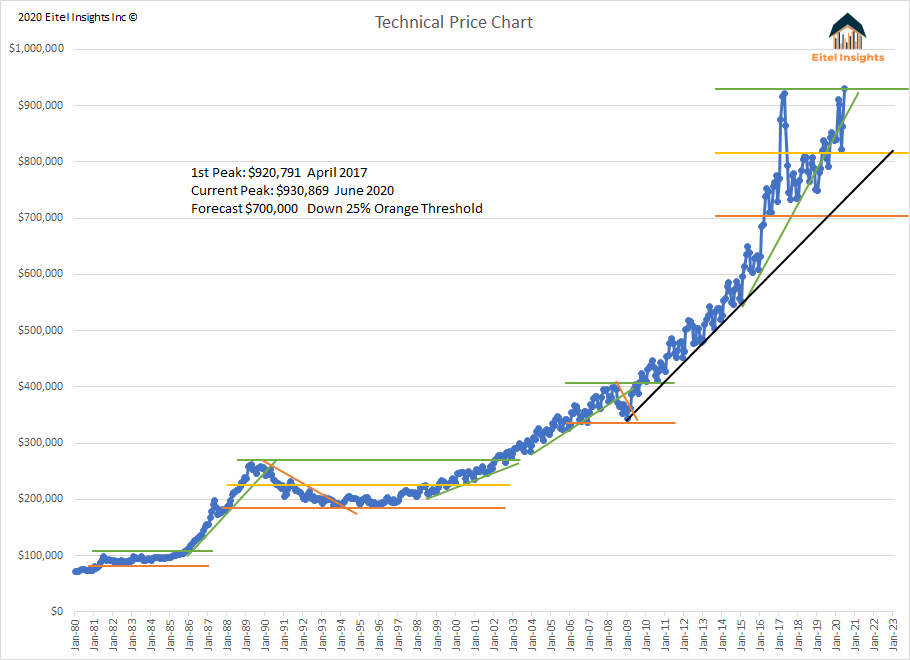
Similarly in the City of Toronto, the average home is selling for the $1.684M. That is up $247,250 when compared to the initial 6 month average of 2020. As with Greater Vancouver the City of Toronto had already found its market cycle bottom of $1.145M during December 2018, implying a drop of -27% from the peak which had occurred during April 2017 at $1.578M.
The goal of the Bank of Canada with the creation of the CMBP was to offer support in order to normalize market functions across Canada. The goal was not to create frenzied environment, but since Greater Vancouver and Toronto housing market have a tendency to be frenzied with frequency, and both market had been stagnant for over 4 years. By enabling the bidding war environment to return; is, in some weird way, supporting a return to normalized markets in the two major Canadian real estate markets.