Please enable javascript in your browser to view this site!

Market Update & Blog

Actionable Intelligence through Analytical Interpretation

New Listings Double Sales Totals for the 6th Straight Month

The newly active listings in September set another all-time high with over 3200 properties going up for sale. This marks the 6th straight month that newly active condos have doubled the sales totals. The oddity is the sales were loudly spoken of, but the new inventory was whispered. Prices were able to inch up despite a majority of the areas inside of the Greater Vancouver condo market off double digit percentage points, with 2 outliers being off 50%+ from their individual market peak’s.

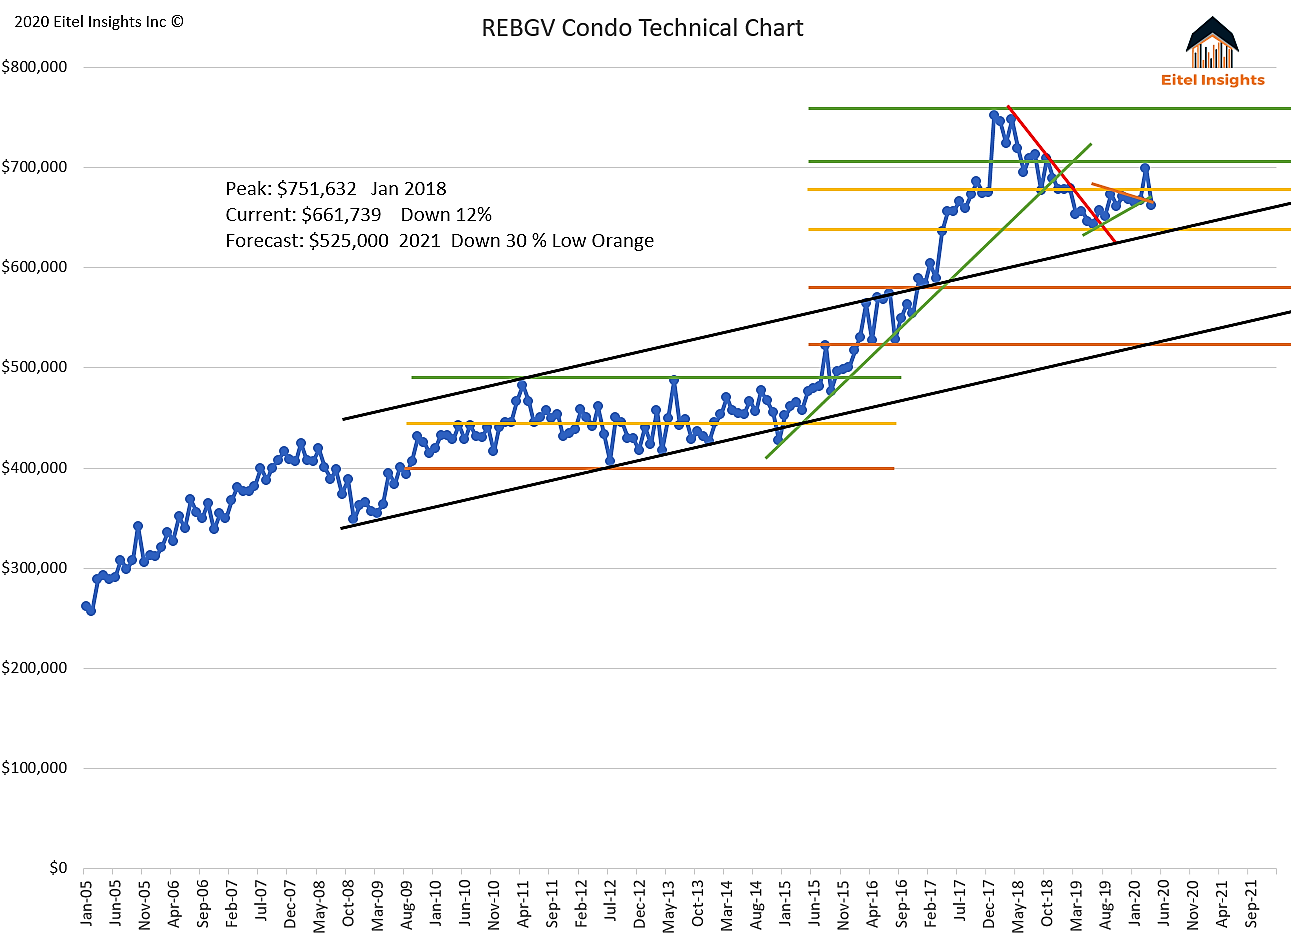
Prices have come down from the peak by 7%. The surprising part of this data point is, when you take the current data of the 19 regions which make up Greater Vancouver, there are 12 regions down 10%+ from their individual peaks. Of those 12, 5 of them are off 40%+.  Understandably the Real Estate Boards recorded data kicks out an outlier or two to give accurate data. It is just surprising that the data indicates only a 7% drop from peak.

The data does have room to run higher before testing the possible downtrend. There could be room for some unusual price activity during the remaining portion of 2020 and into 2021. As those presale completions close. They will inevitably come to the market to be resold. Many will experience losses, some getting out by the skin of their teeth, and the fortunate will walk away with profits.

Technically speaking the downtrend indicated by the yellow line has never been tested since the inception, coupled with a second test to break above the upper echelon channel. The first attempt during March failed.

The preceding two years had clearly an up and down effect on prices. 2018 achieved peak prices with an average sales price of $751,632. 2019 prices fell more than $100,000 from the highs in 2018. Currently the 2020 prices are $50,000 higher than the low in 2019. The probably scenario is the market is creating lower highs coupled with lower lows which will see the market bottom occur during 2022.

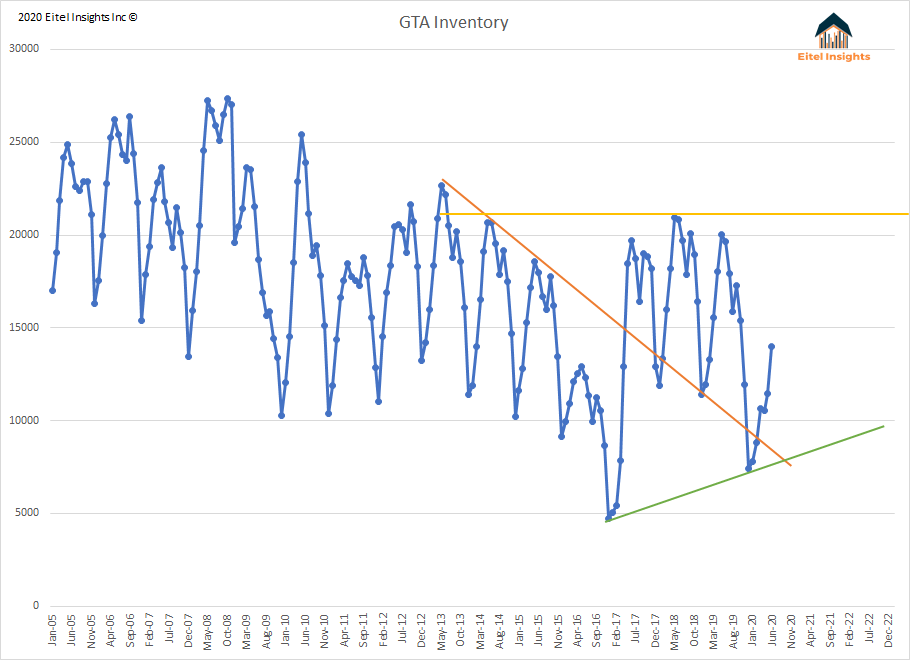
Those presold condos could affect the data in a unique way over the short term. Presale prices do not count towards the MLS monthly average sale price data. Meaning those high valued, small square footage properties will be calculated into the average sales price for the first time. Even as the majority of sellers will lose based on their original purchase price, carrying costs, commissions, the high average sales price could bump the data higher, possibly even as high as the previous peak due to the artificially added value of high valued product newly added into the data metrics. If this does occur, this will likely be a temporary head fake. The growing need to sell has already pushed inventory to the highest levels in the past 5 years. Look at the price chart and the last time inventory was above 7000 actives, price action was very volatile, and could not propel beyond the technical price range. This is what will continue to occur over the upcoming 2021 and 2022 as inventory grows with the need to sell intensifying.

As mentioned active listings are at their highest point in the past 5 years. The seasonal norms, will likely take hold, but given that it is 2020 anything is possible. Due to the lockdowns during the spring the normal activity has been pushed back to later months. September ended with 6279 available condo listings.

The market has continued its record breaking ways again in September with over 3250 brand new listings on the market. Again seasonal norms should take hold, however over the upcoming two years the market is likely to experience 8000+ active listings, with a high probability of 9000 available units which would be an all-time high for Greater Vancouver.

The cannibalization of the market will begin after the majority of presales have completed. Once that occurs and inventory is 8000+, any unit in an older building will have very little chance of selling. The new warranties that come with the new buildings, along with the lower insurance fees, and just the overall new penny effect, will cause older units to be left with very little ammo in the chambers other than lowering their asking prices. This will ripple to the newer units, and the chase lower will have begun.

Sales did finally come through higher sales compared to the past 3 years. Which has had some perennial real estate bulls very excited. But only if you compare the data directly with past September’s. Not when you compare it to previous high water marks of any calendar year. The 1598 sales which took place in September did break out of the stagnant sales range, however when compared with previous years high water data points the sub 1600 sales is hardly anything to write home about, let alone be the headline. Add on the fact that there was the highest availability in 5 years and the newly active listings has doubled the sales for 6 months running. Eventually there will be a straw that breaks the condo’s back.

Condo Price.png
Condo Inventory.png
Condo New Montly Listings.png
Condo Sales.png
Has the pent up housing demand been spent?

Eitel Insights featured on Mornings with Simi on CKNW 980

Link to interview: https://omny.fm/shows/the-simi-sara-show/has-the-pent-up-housing-demand-been-spent

A strong return to activity in the real estate market might be about to cool off according to real estate analyst Dane Eitel.  His latest market update predicts the pent up demand from early in the pandemic has been mostly spent, and things will mellow out with the school year now underway. 

Guest: Dane Eitel, founder of Eitel Insights

Host: Simi Sara, Mornings with Simi

Are there cracks in B.C.'s condo market?

Article Written by Mark Ting CBC NEWS

Link to Full Article: https://www.cbc.ca/news/canada/british-columbia/bc-condo-market-pandemic-1.5740269

Greater Vancouver condo prices peaked in January 2018 at an average price of $751,632 which is approximately eight per cent higher than today's average.  

There are now more than 6,000 active listings, thousands more than we saw in March or April of this year. Granted, would-be sellers were reluctant to list at that time as they didn't want strangers walking through their homes during a pandemic.

As COVID-19 restrictions relaxed, the number of listings increased.  Both July and August had approximately 2,900 new listings each, compared to only 1,400 sales.   

COVID-19 exposed us to the limitations of condo living and also changed how condos are used.

Pre-pandemic, homeowners used their condos maybe 12 hours a day, eight of which were spent sleeping. Much of their work and entertaining took place outside their homes, particularly if they live downtown. That changed with the onset of the pandemic. And as people spent more time at home they missed "space" — green space or a dedicated area to work.

Some people also became uncomfortable sharing common areas such as elevators and hallways.

And much of what makes downtown condo living desirable such as the energy of living in a busy area, nearby culture and entertainment, has been put on hold.  For these reasons and more, those who could afford it have been listing their condos and buying detached homes in the suburbs.   

Pre-pandemic, the expectation was that a wave of boomers would sell their detached homes and downsize to a condo to help fund their retirement. COVID-19 has delayed this move.

For example, my parents were considering downsizing, but the lockdown made them realize just how lucky they are to have a backyard. It allowed them to safely spend time with their friends and family in person — not over Zoom.

Recently, many would-be sellers of detached homes have taken their homes off the market which has limited the supply and driven up prices.  

Add to this an expected surge in condo inventory created by owners forced to sell because of job loss and the end of the mortgage deferral program, and lower prices should be the result. Speculators who have overextended themselves and hundreds of pre-sale units expected to be completed in 2021 could also push prices down.  

Today's condo buyers are very different from the people purchasing during the peak of 2018. Back then prices were rising and there was a lot of greed and speculation in the market. Today there is a lot less speculation and most buyers are local who are purchasing for personal use.

Several forecasters including Moody's Analytics, Canadian Mortgage and Housing Corporation and Eitel Insights, are expecting further weakness in the real estate market (detached and condo) until 2021 and possibly 2022. If these forecasts come to fruition, it is good news for buyers. However, a forecaster's prediction, while often useful and insightful, should never be the sole reason to buy or sell a property. Forecasts are constantly being "revised" as new information comes to light.

Over the next few months, or year, I'm expecting to see further cracks in the condo market. Many investors who bought multiple units near the peak of the market that no longer provide cash flow will be forced to sell at a loss.

If you are in the market for a condo, their crisis could be your opportunity. If the condo inventory continues to trend higher and prices drop, it should result in a strong buyers' market.  If that's the case and you find a home that works for you, negotiate hard and write an offer. 

CBC.png
logo.png
Covid-19 Storm Surges Sales Inside of the Greater Vancouver Housing Market

Highs sale numbers and increased prices come as a relief to many homeowners looking to exit the Greater Vancouver market during September 2020. Entry level markets have seen near term highs in prices while the higher end market has begun sell albeit at much lower than expected prices. The beginning of the school year had a major imprint to the 2020 Real Estate Vancouver market. As the colossal impact of the Covid-19th dust continues to settle, we anticipate less ferocious purchasing going forward, as the pent up demand has seemingly been relinquished with the return of the school year.

Diving into the data, the completed sales did occur in higher volume, many of which were for multi million dollars. The high end of the market was very active this month with seemingly money flowing from weak hands to strong ones. A property was listed for 13.388 Million in 2019, cancelled early in 2020 and then relisted during May at 12.998 Million the sale just was achieved at 9.85Million a cool loss of 3.538 Million dollars. Another seller who achieved a sale had been waiting for more than one year. A property that had been on the market for 533 days just sold for 4.7Million, a nice sale price however, the original ask was 6.88 Million in 2018 then 5.68Million during 2019. The eventual sale price was 2.18 Million less than the asking price during 2018. Even while these sellers were bent over the proverbial barrel the high end sales enabled the average sales price to increase to just over 1.7 Million.

Technically speaking, current prices are testing both the long term downtrend and the low end of the upper echelon in the current market cycle. A triple top indicates a market reversal. That triple top occurred over the course of 2016 -2017. That triple top began the overall downtrend orange line that has forced prices lower and ultimately to test the long term uptrend indicated by the black uptrend lines on the chart. Due to the triple top prices did break below the upper channel of the long term up trend during 2019 which sent prices to the upper end of the low echelon. Eitel Insights believes the triple top and subsequent downtrend will again test the prolonged uptrend and eventually break the trend, which will force prices to retest the low end of the market cycle.

The Real Estate Board has been reminding everyone how well sales during September 2020 are doing compared with September 2019, they conveniently leave out that compared to the overall peak (peak price 1.830 Million), prices are still down 7% along with lower sale numbers. Eitel Insights had indicated over the past year or more, any property can sell, however at continually lower levels until the market bottoms likely in 2021 for most areas across Greater Vancouver. The many examples of current homeowners having to chase the market lower will ultimately push prices to retest the prolonged uptrend.

Going forward we believe the demand will dissipate, as that rush to buy land before the school year was a major factor in the recent bump to sales data. The Covid-19 reaction had families moving from condos to a detached property which caused a spike in completed sales. The sales total which is taken from the amount of completions at land titles accumulated to 1325 which is the highest over the previous 3 years. 2020 has changed the way many people work and how youngsters are learning. If a hard second shut down was to occur parents would become teachers again. The desire for the kids to have a back yard to play in has massively increased. With parents knowing this year mattered more than past or even upcoming years we believe that is what drove the completions during September to be the high water market of the current sales cycle. As time wears on Eitel Insights does not believe this type of intense demand will keep up.

The Detached inventory has remained low during 2020 and is still lower than December 2018 data with only 4773 active properties. Contrast that with the Condo market hitting the highest new monthly listings in the past 15 years and the contrast of the two market becomes obvious. The rapid demand for a back yard from young families surely gobbled up many of the newly listed properties.

The overall inventory did not increase for the first time in the past several months, however the new monthly listings hit the highest since in over a year with 2042 newly activated detached listings. As suggested in months past the seasonal norms will likely not hold true for the remainder of 2020.

The previous yearly high water market for new active listings has always occurred before May each and every year except for 2009 and now again, here in 2020. The major difference between now and then…. No 2010 Vancouver Olympics around to corner to ensure construction and the actual economy doesn’t stop, rather than a couple governments offering meager handouts in order to be re-elected.

The effects of the Covid-19 impact is still percolating in the real economy. While yes, offering free money to everyone, whether previously employed or not, is a boon to the economy at the beginning. Longer term, this will mean more taxes. An unwelcome thought for business owners who are already struggling to keep their doors open. Secondary properties are hitting the market in droves already, as the condo inventory hits the highest point in the past 5 years.

In summary, September was a nice bump higher and ideally sellers took advantage, but ultimately, this great data point, in hindsight, will be seen as nothing more than a lower high on the way to the bottom.

Gain actionable intelligence by becoming an Eitel Insights client by visiting our website. www.EitelInsights.com


Detached Price.png
Detached Sales.png
Detached Inventory.png
Detached New Monthly Listings.png
Podcast: Condo Market Hits Highest Inventory in Past 5 Years

Eitel Insights first video podcast, we hope you enjoy the content.

Historic government stimulus and mortgage deferrals not to mention the eviction ban has held prices buoyant in the intermediate, these stimuli’s are all coming to an end. Eitel Insights does not believe prices will hold their current level as the months continue to progress and the economic climate nationally, and locally worsens.

Inventory is the headline of the August market update. The Greater Vancouver condo market has just risen over 6000. The first time the inventory has been that high in over 5 years. Eitel Insights has warned that need based sellers would continue to force inventory levels higher.

The new normal has people working from home and the need to live downtown has diminished. This trend is likely continue, the old draws that had young working people moving to the city’s core are as gone, as the handshake. With businesses allowing more employees to work from home, no social gathering after work at the favourite watering hole, and no exciting weekends at the night clubs. These and more factors are leaving the downtown real estate market with a glut of inventory.

The rising need to sell is best exemplified through the new monthly listings, which once again was over 2900 new listings. Which marks the first time that has occurred in over a decade. What makes this data and chart interesting is the higher highs along with the higher lows over the previous 2 years. As technicians say the trend is your friend. Higher inventory out of a need to sell, will create intense competition amongst sellers of comparable units which inevitably leads to lower sales prices.

Sept 22 Podcast.png

Historic government stimulus and mortgage deferrals not to mention the eviction ban has held prices buoyant in the intermediate, these stimuli's are all comi...

Michael Campbell's Money Talks Radio Interview

Dane Eitel, founder of Eitel Insights, shares his technical and timing analysis with Michael. As well as his forecasts for the bottoms of the detached home and condo markets.

Host: Michael Campbell

Guest: Dane Eitel

Link to Eitel Insights interview

Link to the full Money Talks September 19th Program.

Money Talks.png

Dane Eitel, founder of Eitel Insights, shares his technical and timing analysis with Michael. As well as his forecasts for the bottoms of the detached home and condo markets.

Condo Market Hits Highest Inventory in Past 5 Years

Historic government stimulus and mortgage deferrals not to mention the eviction ban has held prices buoyant in the intermediate, these stimuli’s are all coming to an end. Eitel Insights does not believe prices will hold their current level as the months continue to progress and the economic climate nationally, and locally worsens.

The Greater Vancouver price chart is testing the long term conservative downtrend which was initiated during the markets peak of January 2018. Prices during peak conditions were $751,000 current prices are $692,978 indicating an 8% decline from the peak. The current test of the downtrend is the second test in the past 6 months. During March 2020 the previous test of the downtrend resulted in a $38,000 price drop the following month.

Inventory is the headline of the August market update. The Greater Vancouver condo market has just risen over 6000. The first time the inventory has been that high in over 5 years. Eitel Insights has warned that need based sellers would continue to force inventory levels higher.

The new normal has people working from home and the need to live downtown has diminished. This trend is likely continue, the old draws that had young working people moving to the city’s core are as gone, as the handshake. With businesses allowing more employees to work from home, no social gathering after work at the favourite watering hole, and no exciting weekends at the night clubs. These and more factors are leaving the downtown real estate market with a glut of inventory.

Lest we forget the upcoming onslaught of inventory that has been scheduled to complete during 2021, along with eviction bans being lifted and government stimulus to be rolled back. Eitel Insights forecasts the need to sell continuing to rise.

The rising need to sell is best exemplified through the new monthly listings, which once again was over 2900 new listings. Which marks the first time that has occurred in over a decade. What makes this data and chart interesting is the higher highs along with the higher lows over the previous 2 years. As technicians say the trend is your friend. Higher inventory out of a need to sell, will create intense competition amongst sellers of comparable units which inevitably leads to lower sales prices.  

August sales of 1336 were lower than what occurred during July. The sales have remained inside of the Identified market cycle since 2017. With the August data concluded thus ends the seasonal hot market. Historically, April to August are the 5 hottest months of the year. During 2020 the sales over the 5 months averaged just 984. Some analysts and the Greater Vancouver Real Estate Board have touted 2020 as a great year simply because it was better than 2019. What a great year looked like was 2016 with the 5 months of hot selling season averaging over 1850 sales per month.

There was good reason for why sales did rise during the past two months. With the second wave of the Corona Virus long talked about, there was a rush for those who had a need to buy to do so, before a potential second shut down occurred. Another reason for the rush, is the extremely low interest rate environment. Now that the US Federal Reserve has stated there will not be any rise to the interest rates until inflation rises well above 2% for a sustained period of time. There earliest projection for accomplishing the 2% breakeven is 2023.

Eitel Insights does not see any reason to rush into the Greater Vancouver condo market especially as a strict investment. Location matters, but timing is everything. There are 20 markets which make up the Greater Vancouver data, and each area has its own velocity inside of their market cycles. Become and Eitel Insights client to find out which market trends are dominant in your neighbourhood.

Condo Price.png
Condo Inventory.png
BC Mortgage’s in Arrears to Triple in Upcoming Years

History has a tendency to repeat itself, one of these cyclical factors is mortgages in arrears. Mortgage in arrears is defined as, a property that is 3 months or more behind on the mortgage payments. Current levels of delinquent mortgages are less than 1000 properties across BC.  Which is the third lowest cycle of data going back 4 decades. The good news ends there.

While rising mortgages in arrears does not make the market go lower in and of itself. Rising numbers or delinquent mortgages is a symptom of the BC real estate market deteriorating.

Historically, after a market cycle initial low has been established, inevitably the next phase of the cycle will be to break the established downtrend, consolidate the base and then the creation of an uptrend which will ultimately test the previous highs and attempt to move beyond old data creating a new high on the chart.

The current data has broken the downtrend which had become dominant after the mortgages in arrears peaked in February 2011 with just under 3,000. Once the peak occurred the aforementioned staunch downtrend drove down delinquent mortgages from over 2,900 in 2013, to below 1000. The downtrend was subsequently broken in the 3rd quarter of 2018. Q3 of 2018 also was the initial low in the establishment of the base. After breaking the 5 year downtrend the base began to form around 900 with multiple tests attempting to go below but to no avail. Give the current data as of March 2020 indicates over 980 properties in arrears. Eitel Insights, is stating, the base has been put in place.

Again, most technicians will tell you after the base comes the rise. The process of discovering the low end of the cycle has occurred, and the market is likely nearing the end of the consolidation phase. The data shows an upper echelon double test occurring attempting to break above the 900- 980 current range.

Not so coincidentally the current cycle low (900 – 980) is higher than the previous cycle, which occurred between 2006 -2008. The range at that time was between 715- 805 delinquent mortgages. The 2006 -2008 cycle was higher again than the previous cycle low during 1990 – 1995. When the range was 200 – 500. Which will lead to the future cycle low likely to finalize higher than our current low range likely around 1100 – 1250 mortgages in arrears around 2029.

2029 is a long time away, so let’s stay with what the BC short term forecast is for now. Now that the base of the cycle low has been put in and the upper echelon of the cycle low is being tested, a breakthrough above 1,000 delinquent mortgages is upcoming. While little in life is certain, based on the chart I would be willing to say that the forthcoming data will look very similar to the last two uptrends. The upcoming climb will make many homeowners themselves, feel like Sisyphus.

The rise to over 3000 delinquent mortgages will likely occur by 2023. Many of these upcoming delinquent mortgage will inevitably be from purchases made during 2016 and 2017 while prices were peaking. As property values continue to fall for the largest market in BC. Greater Vancouver prices have fallen from peaking at 1.830 Million during 2017 to just over 1.6 Million in July 2020. That loss of $230,000 tied in with the economic troubles, add it all up and the result will likely show in an all-time highs for delinquent mortgages transpiring in the not too distant future.

While 3000 properties in arrears may not sound like that high of a number, and it isn’t. The significance is, a major portion of these properties will be forced to come onto the market. With business shutting down and active participation in the work force way down, the possibility of the homeowner working their way out of the financial problem is unlikely. The additional weight of distressed properties hitting the market will force current sellers to become more aggressive as the buyers’ mentality shifts from bargain hunting at current prices and a fear of overpaying for a depreciating asset becomes more prominent.

Given the fact that history repeats, now that you are aware of a strong likihood of distressed property numbers rising, a need to sell that is growing stronger by the month with the bills piling up and the CERB running out. Eitel Insights advises potential real estate investors to bide your time. Yes, location matters…. but timing is everything.

Eitel Insights offers real estate market forecasts in every major area across BC, and all major areas right across Canada. To become a client visit our website and gain access to our analytical interpretation offering actionable intelligence to our clients.

BC Mortgage Arrears Chart.png
In the Eye of the Storm: Vancouver Real estate Detached Homes

As the eye of the storm is eerily calm, so too is the Greater Vancouver Detached Real Estate market. Largely thanks to historic government stimulus. Just a heads up, the stimulus, draws nigh. CERB is coming to its conclusion, the deferred mortgage program is ending, and evictions have returned, now let’s see where the market will head on its own volition. Hint, down she goes.

The average price for the detached market in Greater Vancouver was 1.638 Million. Technically speaking this is the 20th data point since 2016 that has been around the middle threshold of 1.580M – 1.640M. What that signals to Eitel Insights, is this middle threshold is worn out. With over 30% of the data out of the last 58 data points resulting inside of that narrow 60 Thousand dollar band. Our interpretation of these multiple clusters is that prices have exhausted the middle threshold. The next challenge to the Greater Vancouver market will be to find the market bottom (likely at 1.40 Million during 2021), then consolidate that base price. Once that market has accomplished these herculean feats, prices will begin to rise. After the base, Greater Vancouver market will begin to climb, the middle threshold will be broken like water going through a tissue. As there have been multiple test of the threshold on the way down there will not be much need for sustained price tests on the way back up to the peak echelon.

Inventory has continued to grow, and August resulted in 5000 active listings. The highest level in the past 10 months however was still staunchly lower than the 15 year average of 6000 actives. At the current levels the inventory has 2000 less properties than 2018, but the average sales price is only 13 thousand dollars higher. That implies not too many are choosing to be selling their property during this time. The properties that are on the market are more than likely “need based sellers”, which as Eitel Insights has forecasted will continue to rise. One example of why there are less sellers than two years ago. The market was still considered by other analysts to be a hot market, listings were high as Realtors told sellers they could name their price and a buyer would pay it. That possibility never actually transpired, what did occur was a cancellation many listings, based on the Realtors advice that next year will be better, wrong again. Here is one example property out of many examples had listed for a pie in the sky price during previous years. A property listed in 2018 with a 1.658 Million list price, never sold, relisted in 2020 at 1.378 Million and sold for 1.285 Million. Want another example? Here you go, 2017 list price of 5.288 Million, 2019 list price 4.788, price reduction down to 4.388 Million, another reduction to 4.25 Million. 2020 list price 4.099 Million, sold for 3.80Million.

Would either of those properties have continued to chase the market lower unless there was some kind of a need to sell? I doubt it. This need to sell will continue to permeate throughout the detached market.

Sales ticked lower in August with 1108 sales, compared to July which had 1134. With the sales escaping the identified channel the past two months, we anticipate the data to return lower as the economy will be on its own, without the aid of any government buoys. The government did everything to halt the economic impact of Covid-19 across Canada, especially in the two largest real estate markets (Toronto & Vancouver) now that the government’s intervention in to the free market is coming to the end. The forthcoming data will continue to under deliver in upcoming quarters, now that folks have to go back to spending money they earn rather than spending the handouts.

After the anemic sales during April and May, the sale surge during July and August, should not come as a huge surprise. Taking all of the past 5 months of sales into consideration, April 393, May 544, June 873, July 1134 and August with 1108, the average is 810, when compared to the previous 2 years the average is good. However as you will remember, Eitel Insights has stated this market has been falling off since peaking in 2017. The 5 year average of sales during the 5 month span is 1163 sales indicating the 810 to be less than stellar.

Yes, we are aware that interest rates are low, but now that the governments have moved off of the standard 2% inflation target, I do not see any real panic to lock in the rate before they soar higher, do you? If you don’t, we suggest to practice patience and look to accomplish a sale at a lower price point with more selection during 2021.

Eitel Insights has offered 2021 as a target to purchase since 2017, unlike all other analysts who have flipped flopped over themselves in the past few years, we remain staunch due to our ability to block out the noise and stick to the analytical interpretation. These ever changing fundamentals that most pontificators speak on are on data that transpired a quarter ago at least, this data is tainted with the CERB and other unusual stimulus. Those fundamental negative results will not be seen until 2021, then they will say the sky is falling after it already fell.

Real estate need not be, buy, and close your eyes. With Eitel Insights we open your eyes to the possibility of tackling the largest purchase of a life time with unemotional analytical interpretation, along with a history of accurately forecasting various markets across Canada.

To become an Eitel Insights client and be able to accrue actionable intelligence through our analytical interpretation, visit www.eitelinsights.com

Detached Price.png
Detached Inventory.png
Detached Sales.png
The Greater Vancouver Condo Market Should Prepare for Volatility.

The Greater Vancouver Condo market is experiencing another stagnation period in price movement. Over the past three months prices have remained within a three thousand dollar bracket. Current prices are retesting the higher echelon of the middle threshold in the current market cycle. The average sales price is down 9% from the peak, signalling there is plenty of room to drop. Eitel Insights forecasts that during 2022 prices will have dropped nearly 30% from the peak experienced during 2018.

Prices have remained in another very tight range similar to the previous tight cluster of prices during 2019. The previous cluster sent prices higher pre pandemic. What is different this time is the Inventory is on the rise and growing much faster than the sales. Once the buyers eventually learn that they are in the driver’s seat, prices will begin to drop with gusto.

New listings grew at the highest pace since 2010 for the condo market, with over 2900 brand new active listings. Which is roughly 750 more new listings than the average over the previous 5 July data points. The sales did grow no denying that, but only by 159 sales from July 2019. Also over the previous 5 year average the July sales were actually down over 250. Seems like there is more of a need to sell than a demand to buy. The last two months of newly listed properties equals over 5700 new listings, the highest two month span in a decade.

With the abundance of new listings, the overall inventory grew by another 600 compared to June’s inventory. While sales did rise, not enough to mitigate the growing need to sell. Inventory numbers have risen to the 2nd highest peak in the past 5 years, with over 5600 active listings. Still to come is monstrous amounts inventory to be introduced to the market from the presales. Worth mentioning is the end to the evictions ban will likely be occurring in September. While the CERB is also seemingly coming to an end, and those whose are still without work who qualify for EI will be getting less money and some simply will not qualify. None of this bodes well for the demand sector of the Condo market.

The notion offered by some perennial bullish market watchers that due to the higher sales numbers in July, the Covid-19 effect has been nullified is erroneous. Yes sales have increased, but ever stop to wonder why? One answer is prices are down 9% and the price per square foot continues to drop signalling properties are selling for less money. Secondly those who had been pre-approved, pre Covid have followed through with those rate holds. There is usually a 90 -120 day prequalification rate hold. The idea that someone would purchase a home before they are about to lose their job is seemingly farfetched, but in this ever indebted society that is exactly what has been occurring. The 1404 sales which occurred in July, hold a distinct possibility that some of those new owners would not have qualified for that mortgage if they applied today. Those CERB payments helped greatly with the first mortgage payment but what happens to that owner once the free money era comes to an end. As stated the last two months had over 5700 newly listed properties, while the sales have achieved just over 2400. The trend is in the buyer’s favour.

Business’ that have been on hold are eager to get back to work, the challenge that most business are experiencing is, the market isn’t as eager to purchase as they are to sell. This will result in staff returning to work, only to be let go in short order. The economic impact of the first shut down is still in its infancy, imagine a second shutdown and the long term effects that would hold. Even if there is no second shut down the economic landscape will remain changed. With personal job, wealth, and health uncertainties not to mention those in your family who you may need your help. The idea of buying another expensive pair of shoes or a new watch, just because, are days gone by for most.

The market has been artificially propped up with free money, once that comes to an end, taxes will inevitably be raised to refill the governments desolate coffers, the full impact of Covid will be felt. With a glut of inventory and a lack of potential renters and purchasers, the roll out of this recession is well underway. Ultimately resulting in assets being sold, primarily secondary condo properties.

In summary, Eitel Insights cannot wait to offer a positive outlook for the Greater Vancouver Condo market, but the analytics of the current data projected into the future is not positive, we believe it is our obligation to offer actionable intelligence through analytical interpretation not pie in the sky optimism.

Not all markets in Greater Vancouver are created equal, some areas are closer to the bottom. While others still have significant percentage losses upcoming. Become an Eitel Insights client to find out which are which.

Condo New Montly Listings.png
Condo Inventory.png
Condo Sales.png
Toronto Real Estate Prices Creating a Double Top?

Greater Toronto Area Market Update.

The Greater Toronto market has experienced a prolonged uptrend which has propelled prices up 127% since 2010. The aggregate average sales price had initially peaked in 2017 at $920K (125% Growth over 7 years), with June 2020 recording a $930K price. These two data points are seemingly creating a double top for the GTA real estate prices.  

The first break in the armour was the rapid uptrend (green line) established in 2016, which rose prices over $290,000 in a year and a four months. That uptrend broke in 2017. The rapid uptrend was not sustainable growth rate, prices subsequently retreated back to our forecasted higher echelon of the lower threshold $750K during the end of 2017 and into 2018.

Eitel Insights analytics is noticing a double top is forming in the GTA prices. After the creation of the first peak in 2017 with current prices representing the second peak. After peaks comes valleys, the GTA has remained in an impressive uptrend since the market took a temporary pause in 08-09. That uptrend (black line) is about to encounter a serious test which will cause market volatility.

Prices will begin to search for their market cycle lows, just like every other market cycle previous. The chart has identified a few pricing threshold that will be tested in the upcoming months and likely years. Eitel Insights anticipates the market bottom to occur and create a channel which the market will remain likely until 2025.

With a double top forming in the price chart, we next take a look at the supply demand factors. Inventory has seen the bottom during December 2016 with only 4700 active properties. The most recent bottom came during 2019 with over 7400 active listings. Still well below the 15 year average of 17,800 actives, but a higher low none the less. Equally as important, the data is officially breaking the downtrend that had been in play since 2013 signalling that trend has completely come to its end. Going forward we anticipate inventory to continue in an uptrend meaning with higher lows and higher highs in the reported data.

The magical number of 21,000 active listings which hasn’t been broken in the past 7 years, will eventually relent in the upcoming several quarters. Inventory had been getting sold in record time and record money in years previous, this in turn has kept the inventory a nominal levels, while increasing the asking price.

The sales chart demonstrates there has been less demand at current prices, a trend which has been developing seemingly unnoticed by most. Sales are not low in 2020 solely due to Covid-19. No, they have been trending lower since 2016. In fact sales have not remained above 10,000 since 2016. June 2016 had over 10,000 sales and the month ended with 12,000 inventory. Since then inventory levels have surpassed 19,000 each summer with ease, however the sales have not risen above 10,000 since, with one data point being the exception during 2017. That signals to Eitel Insights, increasing demand to sell with decreasing demand to buy.

Demand has waned. Up next anticipate an increase to the supply without nearly the amount of a buyer as years previous. This upcoming reality inevitably creates competition amongst sellers, which in turn, leads to lower asking prices. As with any cycle, the overheated frenzied activity eventually ends, and gives way to a whole new kind of chaos on the other end of the spectrum.

The condo market in particular will see a chaotic atmosphere, as newly completed properties begin to enter the GTA market in 2021 and predominantly in 2022. The flood of inventory that is on the horizon is eerie enough, throw in the investor market that hasn’t received rent since Covid-19 hit and cannot evict the tenant going through the proper channels until who knows when. Once the investors do get their properties back, selling will be on the mind. Unfortunately this example will occur by the hundreds, and the market will flood with new and older inventory.

The historical chart is calling for a similar market cycle to the one that occurred from 1989-2002. After a 4 year uptrend prices shot up 167% to reach the all-time high of $261K in April 1989. After peaking the search began for the market cycle bottom, which occurred multiple times throughout the 11 year price channel.

Eitel Insights is not calling for an 11 year channel, however we are stating that the market cycle began in 2017. 3 years later and the current data is simply confirming the previous high, as time marches on prices will begin to work their way lower and find that market bottom. We are forecasting a 24% correction, indicating prices will test the $700K threshold in the upcoming years. The bottom will likely occur in 2022, once the inventory has flooded the GTA.

Not all markets across Canada are created equal, some areas are closer to the bottom. While others still have significant percentage losses upcoming. Become an Eitel Insights client to find out which are which. 

GTA Price Chart.png
GTA Inventory Chart.png
GTA Sales Chart.png
GTA Historical Price Chart.png
Eitel Insights featured: Vancouver housing analysts disagree about overall impact of COVID-19

VANCOUVER (NEWS 1130) — The same week B.C.’s finance minister said housing sales dropped a whopping 45 per cent because of the pandemic, some real estate watchers say the situation isn’t so bad, but others are convinced it will take several months for the Metro Vancouver market to rebound.

Carole James says prices fell four per cent between February and May, but Michael Ferreira who is the managing principal of Urban Analytics (which tracks data for developers) says prices are already coming back up.

“We may have weathered the storm pretty well and may not see much change in terms of pricing and given what’s happening in the new home market, a lack of new supply over the last two years could be seeing a different story in two years as far as upward pressure on pricing again.”

He says there’s no doubt the real estate sector has suffered during the pandemic, but it could have been worse.

“You would have expected with COVID that prices would have dropped, but we saw supply drop right off, demand get sustained –especially in May and June. Without that supply there, create situations where you have multiple offers again and puts that upward pressure on pricing.”

However, Dane Eitel with Eitel Insights predicts prices will continue to drop until at least next year.

“The truth is the inventory is rising. The condo market had 2800 brand new, active listings in the month of June. That was the highest month since 2012. There’s not a pent up need to buy, but there is a pent up need to sell.”

He adds sales in May were the worst they’ve been in 15 years with only 325 more detached homes and 450 extra condos sold in June.

“The inventory in the detached market grew more than 700 and the condo market grew over a thousand from the previous month, so you tell me where is the pent up demand?”

Eitel tells NEWS 1130 his research shows there’s more inventory now than there was eight years ago, so it could take several more months for prices to start climbing again.

“Most markets in detached properties will be in 2021, the condo market will likely be in 2022, so we will eventually be positive about this market, but as it currently sits, it’s very difficult to be an optimist, unless you’re a real estate activist. You’re not really acting as an analyst.”

Ferreira insists the situation has significantly improved since the last week of May when the lockdown was lifted.

“We certainly saw an uptick in sales. Even though it’s lower than the ten year average, we were still significantly higher than we were last year, as far as sales go.”

Ferreira also tells NEWS 1130 some owners of short-term rental properties may not be able to wait for the borders to open up, so they can book guests from other countries.

“A lot could pivot and switch that over to a long-term rental, so that’s an option that they have and I know, some probably already have because we are seeing a bit of a dip in rental rents. That could be a combination of –a function of more supply coming into the market as the result of some of those AirBnB units getting converted to longer term rentals, as well as a drop in the immigration, so you don’t have all the international students that would typically come and be renting product at this time –getting prepared for the school year in September, so the combination of those two probably softens the rental rate market a little bit. Certainly, there are some that might decide it’s not worth the hassle, so I’m going to put it on the market, but to date, I don’t think we’ve seen huge evidence of that so far.”

Even so, he admits what keeps him awake at night is what happens if there’s a second wave of the pandemic and the economy shuts down again.

Eitel insists some buyers are already taking their time because they’re worried about paying too much for something they can get for a better price next year.

“That is a fear of overpaying for a depreciating asset, so into 2021 when prices are attractive, buyers will be fearful that prices will continue to go lower and that will be a tragedy for those that miss out on this historic opportunity upcoming. Some sellers are seeing that they will need to sell, but praying and holding on for dear life that won’t come to fruition, but eventually it will. In 2021, you will see the roll out of foreclosures and that’s where the investor mindset starts to change and starts to purchase properties at a discount. And, that will force the average sale price lower because no longer are they looking at mansions that were selling for $17-million and actually selling at $12-million. They’ll be looking at properties listed for a million and maybe selling for $800-thousand.”

Despite warnings from Eitel, the president of Pilothouse Real Estate Inc says Metro Vancouver is so “desirable,” most people born and raised there can’t afford to buy a home in that market.

Vince Taylor, who specializes in pre-sale condos, insists demand is still stronger than supply.

“Just like you can’t live in Manhattan. You got to go live in Brooklyn. What we’ve done is created such a magnificent corner of the world, it is really hard to live here. This is one of the greatest cities in the whole world and real estate will be priced here accordingly.”

He’s also suggesting prices will go up when thousands of immigrants rush here once non-essential travel is allowed again.

“And in fact, there’s an enormous influx of people waiting to come to Canada –Vancouver in particular, but they can’t come because the airport is closed. This is the time when the professional real estate buyers are buying. When the airports open, prices are going to go crazy.”

Taylor agrees some owners –hoping to capitalize on short-term rentals for companies like AirBnB– are selling off those properties or turning them into long-term rentals which helps explain why vacancy rates are climbing in parts of Metro Vancouver.

However, he says he doesn’t believe many people will be forced to sell their homes because they can’t afford to cover their mortgage or they’ve lost their jobs during the pandemic.

“Add that to what’s going on in Hong Kong, you’re going to see about 80-thousand people arrive in Vancouver –one of the safest, most beautiful, world-class cities with no supply. If you don’t have many apples and you’ve got lots of people that want apples, the price of apples goes up.”

On Tuesday, the provincial government predicted a $12.5 billion deficit linked to the pandemic with Finance Minister Carole James saying, “This could be the worst downturn experienced in our province in recent history.”

Written By Marcella Bernardo News 1130 CKNW City News

Facts vs Fools Gold. Greater Vancouver Condo Market Update.

Condo sales prices were higher in June compared to May and the year previous, similarly sales were higher than the previous month and year as well. However to say that the Condo market is forecasted to go higher and that there is pent up demand, is simply a fallacy. There will always be a need to buy and sell, currently that is the case there… some demand and a lower demand than previous years. As prices continue to trend lower beyond the 10% current drop there will continue be sales. The market will never flat line, but remember just because the Greater Vancouver Condo market has a pulse, doesn’t mean it is out of critical condition.

In reality with how the current market sits, it is very hard to be positive about the Greater Vancouver Condo market, yet some still are. We explain why we are not and you shouldn’t be either.

Prices as mentioned were higher in June with the average price finishing at $679,294 albeit a measly 1 thousand dollars from May’s sales price of $678,495. Hard to get excited about those numbers. Especially since June was the month when the supposed pent up demand was expected to be released, after being housebound for 2 months. Prices are still down over 10% from the market peak in 2018. The pent up demand is a whisper in the wind compared to the rising pent up need to sell.

As the market progresses to feel the effects of the Covid-19 the mortgage deferrals will eventually come to an end. The tenants that haven’t paid will be asked to leave. Not to mention all the presold properties that will flood the market as the completions continue which a whole beast on its own. The inventory has no choice but to skyrocket.

Another sign of a faltering market is prices remaining steady while the price per square foot falls.

The price per square foot has fallen from the peak in April 2018 when condos were selling for $847 on average, to currently selling at $767 PPSQFT. The month over month drop was $34 per foot, the largest drop since 2018. The per square foot prices has fallen back to the upper edge of the downtrend.

This is signalling larger properties are selling for less money. With the average price remaining steady and the PPSQFT dropping results in a negative forecast for the condo market. Once higher valued properties sell at discount there will be less willing purchasers at the lowered valued properties as they begin to perceive the market is headed lower.

While we anticipate the Condo average price dropping around 30%, while we anticipate a 19-24% drop in the price per square foot chart. As the newly completed units become for sale or resale, the buyers will want new properties with warranties as the insurance issue continues. As a result elder buildings with higher square footage will sit on the sidelines until they drastically reduce their prices.

Inventory has finally broken out of the prolonged downtrend that propelled the inventory lower since 2012. During 2019 the inventory had temporarily surpassed the downtrend only to relent and retreat back into the comfort of a long term trend. Going forward we anticipate the downtrend to be broken for good, as inventory works its way back up to 5900 active listings, the near term high achieved in 2019.

With inventory surpassing 5000 for the first time since September 2019. Market prices are undoubtedly headed into the buyers favour as inventory continues to rise in 2021 and 2022.

There were over 2800 newly listed Condos in June the highest single monthly total since May 2012. Which elicits our point of pent up need to sell being more prevalent than any supposed pent up demand to buy let alone, invest. Furthermore the inventory rose over 1000 from new listing in May as the rise in Sales only ticked up 451 during the same time frame. The data is indicating a doubling of the inventory rise to that of sales.

As stated the Sales for the Greater Vancouver Condo market did rise to over 1000 sales in June, a significant rise from 655 in May. The numbers are better but far from glorious. The sales were the 2nd worst June on the chart which goes back 15 years.

The chart depicts the sales data squarely in the middle of both the downtrend and the low sales channel.

Not all markets in Greater Vancouver are created equal, some areas are closer to the bottom. While others still have significant percentage losses upcoming. Become an Eitel Insights client to find out which are which.

Condo Price Per Square Foot June.png
Condo Inventory June.png
Condo Sales June.png
The Devil is in the Details, Greater Vancouver Detached Market Update

June sales increased along with the average price, major win for the bulls? Not even close, the headlines can be deceiving. Once you take deeper dive the recent data is very bleak. The accepted offers in June 2020 are the lowest June in the past 15 years. Homes sold for a higher price than the month before but, for the first time in a quarter, and only up 2% from May.

Even during a downtrend the prices will create higher low data points while still trending lower to find the bottom. Some have stated that the Corona Virus shut down will create a pent up demand, I hope this isn’t the demand they were anticipating because it’s a blip on the charts.

The average sales price for June came in at 1.619Million, signaling the first positive data point since February. July will be hugely important in setting the next short term trend for the Greater Vancouver price chart. If the July is lower than 1.619Million there is a strong likelihood that a new aggressive downtrend will be established. The possible downtrend is indicated with the yellow downtrend marker. We have purposely used yellow at we need confirmation before the downtrend is established.

One anticipated trend that we have spoken on before is now coming to fruition, that being, the high end market is selling more readily than the lot value properties. Buyers are wanting the most bang for their buck and as a result they want the 17Million dollar mansion for 12Million and one such sale took place in June. Not too many buyers are purchasing spec land, this has an effect on the average price. Which means once those foreclosures roll in, and investors begin to dip their toes in the water. That will shift the focus from trying to buy the high end on the cheap to buying homes near lot value.

This also indicates that even while mansions are selling for very high numbers, the average price is still in the middle of the market threshold. Once the foreclosures hit and inventory is high, investors will begin buying deeply discounted lots which will force the average price to further decline. Then the market will panic, but in reality, the investors buying lower valued properties will indeed force the prices to drop but simultaneously be creating the market bottom. The pricing bottom will likely occur at 1.40 million if this threshold breaks we look to 1.225Million as the next threshold.

Detached Sales could be interpreted as “six of one and a half dozen of the other”. Simply meaning you will hear likely hear that the June 2020 sales were the highest over the preceding two year. Technically true, but the June 2020 sales was the lowest excluding the previous two year over the previous 15 years.  Don’t let the language fool you when you hear best June in the previous two years. The past three years of June sales data are the lowest in the past 15 years. Not a great trend to be a part of yet Realtors and the Real Estate Boards will likely tout this as a win.

Another truth even though it may hurt some, the pricing peak for the market occurred in 2017, However sales numbers began to tank substantially since the frenzied mentality of 2015 & 2016. Sales numbers have not exceeded 1000 since June 2017, while the average over the previous 15 years is 1050. The reality is the Greater Vancouver detached market has been trending lower for many years already, while most analyst and definitely the GVRD real estate board been saying we were nearing the end of the tunnel by being able to see light in 2019… Eitel Insights warned that the light was a train, not the end of the tunnel.

Last truth, we know sales are from previous months accepted offers. The accepted offers in June 2020 were only 561 and the absolute lowest June in the past 15 years. For context June 2019 accepted offers were 804, June 2018 were 755, June 2017 were 1,216, June 2016 were 1,446, June 2015 were 1,816. So much for best in the past 3 years, Eh?   (Happy Canada Day)

Sales are not good nor are they average in fact they are paltry, inventory is on the rise and will continue into 2021. None of this bodes well for prices in the short term.

Inventory finally surpassed 4200 active listings which hadn’t occurred since December 2019. The inventory currently sits at 4471. Once the mortgage deferral system comes to an end the inventory will rise rapidly.

Over the upcoming year an odd phenomenon will occur to the buyer’s mindset. Far from the chaos of 2015-2016 when frenzied buyers lined up and fought over who would pay the most in history for a home. Into 2021 a whole new kind of methodology will prevail, the fear of overpaying for a depreciating asset. When inventory is at the highs prices will be at the lows but purchasers will be fearful when they should be strong.

All that said, purchasing when a market is actually at the lows of the cycle is a great idea .Eitel Insights will be releasing a full market analysis for Greater Vancouver in the upcoming week. We proudly announce that Eitel Insights will be promoted by Michael Campbell’s Money Talks. In this report we analyze all 20 markets inside of Greater Vancouver and update the data monthly so you can know exactly when and where the opportunities reside, which are currently rare but do exist right now. 

With our newest product release you will know exactly where each market inside of Greater Vancouver is with respect to the individual market cycles, for prices, inventory, sales, moving averages, strength index, and our unique supply demand chart. Use our analytical interpretation for your actionable intelligence.

Not all markets in Greater Vancouver are created equal, some areas are closer to the bottom. While others still have significant percentage losses upcoming. Become an Eitel Insights client to find out which are which.


Detached Price Chart June.png
Detached Sales Chart June.png
Detached Inventory Chart June.png
Eitel Insights Interview with Simi Sara 980 CKNW

The pandemic has raised no shortage of housing questions: for people who have been waiting to buy or sell since the outbreak began, will this summer bring more certainty? For renters looking to change locations, is now the right time to move? And for homeowners who have seen their nest egg deplete, will the equity in their homes rise again?

Host: Simi Sara 980 CKNW

Guest: Dane Eitel

Link: https://omny.fm/shows/the-simi-sara-show/no-shortage-of-housing-questions-during-the-pandem

Dane Eitelrealestate
Prices are Down, Sales are Way Down, and the Horizon Looks Ominous.

Money Save is Money Earned.

May 2020 will be remembered as the month CMHC finally turned negative. They stated the two major markets in Canadian Real Estate will be going lower for the remaining portion of 2020 and into 2021. Something Eitel Insights has been stating correctly since 2017. The CMHC forecast sounds very familiar if you think about it.
Eitel insights stated in 2017 prices had peaked and would decline until 2021 dropping from 1.830Million to 1.4Million. In 2018 we stated, if 1.4Million does not hold as a bottom then as low as 1.225Million would be tested.
The CMHC forecast as of May 2020 calls for a 9% - 18% drop. Interesting, since the average sales price in Vancouver was 1.6Million that would put their forecast at 1.45Million for 9% drop or 1.3Million at an 18% drop. Just a bit of a rosier colour than our forecast offered years ago.
The exactness of Eitel Insights forecasts been unmatched, while others have continued to flip flop their positions, we have remained true.


Greater Vancouver detached prices in May dropped to 1.585Million which is the middle threshold of the market cycle. Seemingly breaking the uptrend that has been prevalent since September 2019 and instigated with an average sales price of 1.5Million.
CMHC tightening the purchasing restrictions for mortgages with less than 20% down will only perpetuate the tough market conditions. With the old normal, prices were in decline, and our new normal is not very promising. Prices will continue to search for lower prices as the market goes forward. We do anticipate a test of 1.4Million in 2020 with 2021 confirming the market bottom.
Gone are the days of 10 year outlooks, Eitel insights has advised potential purchasers to steer clear from buying at the market peaks. To date over $245,000 (from 1.830Mil – 1.585Mil) saved if the temptation to purchase has been resisted through our analytical interpretation. The 10 year outlook, if purchased in 2016 after 5 years will be down by $430,000, once 2021 realizes the 1.4Million forecast. Meaning your investment is negative, which forces you to put more time and money into an asset that is underwater.
Once the bottom is confirmed by our analytical process, prices will begin to increase back up to the old market high and beyond. This is how Eitel Insights clients invest, we analyze and observe, and then step to the plate buy at the low echelon of the market cycle. We cannot wait to offer the opportunity to make money in the Real Estate market rather than saving you money like we have been, but remember, money saved is money earned.


Sales are the headline, with only 544 detached sales taking place at land titles in May 2020. The accepted offers in May were only at 525. Which has been quoted as a great number compared to 370 in April and true enough but beating a lame duck doesn’t make you a champ.
Let’s take a look at the past 5 years of May accepted offers. 2015 had 1837, 2016 had 1820, 2017 had 1503, 2018 had 839, 2019 had 839, and of course we just had 525 accepted offers last month. This epitomizes what we have been try to explain would transpire. After peaks comes valley’s. The peak was frenzied, the bottom will look deserted. We advise purchasing during the desertion, while there is copious amounts of inventory and prices at the lower end of the market cycle.
The historically low sales numbers experienced recently, are occurring during the usual peaks, you can imagine what the sales number will look like during the seasonal market lulls.


Inventory has hit an artificial ceiling of 4200 active listings across Greater Vancouver. This number has been tested twice thus far. Once the 4200 level is broken we anticipate the next levels to be broken with relative ease. The upcoming levels are 4500 and then of course 5000, at the 5800 level the market will meet up with the 15 year average.
One interesting point on the chart is the high levels of inventory during the market peak of 2017 was the seller’s choice to trade their property for an all-time high sale price. This upcoming high level of inventory will largely be out of need to sell. These upcoming sellers will have a very different modus operandi.
Once inventory return to normal levels which will inevitably occur, we anticipate the downturn in prices to return with gusto bringing the average price down an additonal $185,000 lower than the current price.


Again, Eitel Insights has saved a potential purchaser $245,000 to date with more savings on the horizon. Stick with the industry leader, since inception Eitel Insights have led all contemporaries.


Not all markets in Greater Vancouver are created equal, some areas are closer to the bottom. While others still have significant percentage losses upcoming. Become an Eitel Insights client to find out which are which.

Detached Price Chart June 2020.png
Detached Sales Chart.png
Detached Inventory Chart June 2020.png
Condo Prices are expected to drop until 2022

The condo market just gave back the 5% gain in the previous month. After months sitting inside of a 1% range the condo market made its move in March. Only problem, it was the wrong way. Prices had shot up to just $699K, one month later the Condo market has recognized its mistake has come back to the $661K pricing threshold.

No so coincidentally, at the price point where the market spent 6 months deciding whether to rise or fall. The resulting short lived retest to the upper echelon got optimists excited. The challenge, the move was a head fake.

The technical feature of the divergent trend is over, next we forecast a prolonged downtrend of lower highs for the reaming months in 2020 and a further decline in 2021. Ultimately the Condo Market will test the $525,000 threshold, which hasn’t been seen since 2016. Signalling that 5 years of investment will have netted an investor zero increase of equity. 

The 2015 investor with a zero equity increase will be the envy of all those who invested during the market frenzy of 2017-2018. The average purchaser in January 2017 paid $584K (upper orange line) and by January 2018 prices had increased to $751,000(upper green line). Every Condo purchased during these times will technically be under water in the upcoming years as prices test the 2015 threshold of $525,000. Meaning the 2017 investor who purchased at an average price of $584K will be down $59,000 and the $751K Investors purchases during the peak, will be down $225,000 in 2021 on average.

Investing in real estate is not for the feint of heart. I vividly recall in 2017 the line ups for presales and the amount of complaining that occurred from those who didn’t get a chance to purchase because some investor bought multiple units. Thank your lucky stars those investors. Now it is them on the hook instead of you. In the upcoming months as those pre sold buildings are completed you can purchase that same unit at a discount. Crazy how life works out.

That being said we do not advise any investment purchases or even owner occupied purchases in the current market. We would prefer buyers wait until prices are much lower than $661K. Prices will continue lower as the inventory increases. Supply demand factors cannot be ignored.

As for the investor owners who are about to be caught in this chaotic market, our advice, sell in May and go away… for years. Wait until prices reach the lower echelon of the market cycle before re-entering the Greater Vancouver condo market.

The inventory remained similar from the previous month. April finished with just under 4000 active condos for sale across the lower mainland. Over the next quarter we anticipate an additional 1000 active listings to join and remain on the market.
Age isn’t just a number, by that we mean elder buildings will have a tremendously hard time in the upcoming years. As the presale properties work their way onto market which will cause added competition, add the insurance concerns, and common sentiment to like a new shiny object. The resale market will be living the hard knock life.

The April totals for condo sales across Greater Vancouver was 508. Marking the lowest April data on the record. April’s sales historically fall around 1100. The forecasts gets even worse, as we have stated in the past, sales numbers come from land titles meaning the recorded sales for April actually came from the previous months accepted offers.

The 508 April completions could have possibly come out of the accepted offers earlier in the year. January had over 900 accepted offers, February had over 1100 while March saw just under 1000. The gloom and doom of April 2020 only realized 257 accepted offers across all of Greater Vancouver. Buckle up condo owners it’s about to become a bumpy ride.

* Not all markets in Greater Vancouver are created equal, some areas are closer to the bottom. While others still have significant percentage losses upcoming. Become an Eitel Insights client to find out which are which.

Condo Price Chart May 2020.png
Condo Sales Chart May 2020.png
Eitel Insights Featured by NEWS1130 CKNW

Eitel Insights interviewed by Marcella Bernardo of NEWS1130 CKNW on May 19 2020

Condo Price Chart.png

VANCOUVER (NEWS 1130) — Now isn’t the time to buy real estate if someone is willing to wait for a better deal, according to a local analyst who predicts condo prices in the Vancouver area are set to decline for years.

Eitel Insights founder Dane Eitel says it’s not the time to try to catch a falling knife, or rather the longer someone holds on to a property they can’t afford, the harder it will be to get rid of it.

He’s advising buyers who can afford to wait for a better price to hold off until at least next year since “need-based selling” will be coming into the market in 2020. He says many investors facing hardship because of the pandemic are also feeling mounting pressure to sell.

“So, I would definitely hold off purchasing a condo. You could really almost sell your condo property right now and go away for a long time, come back and you’ll see that similar type property at extremely lower values.”

The average price for a condo is more than $660,000, but he says that’s going to change.

“For the condo market, January 2018 was the peak at $750,000. Currently, we’re down 12 per cent from that. We’re right at $660,000 for roughly six months in a row in the condo market average sale price,” Eitel explains.

Within two years, he says that price should fall to $525,000 in a few yeas, and heavily-mortgaged owners may soon be forced to sell.

Click link to read full article: https://www.citynews1130.com/2020/05/19/condos-prices-to-drop/

Dane Eitelrealestate
Eitel Insights Interview with Simi Sara 980 CKNW

Chapter 1: It's a bleak outlook for homeowners, and there's a real concern about the foreclosures that will likely result from it. Guest: Dane Eitel, founder of Eitel Insights. Chapter 2: With restaurants, salons, and shops reopening this week, some are charging an extra fee.

https://omny.fm/shows/the-simi-sara-show/outlook-for-homeowners-bleak-charging-a-covid-tax?t=39s

It’s a bleak outlook for homeowners, and there’s a real concern about the foreclosures that will likely result from it. 

Host Simi Sara 980 CKNW

Guest: Dane Eitel, founder of Eitel Insights.